🌍 Public
Fork of Surendar Bar Chart
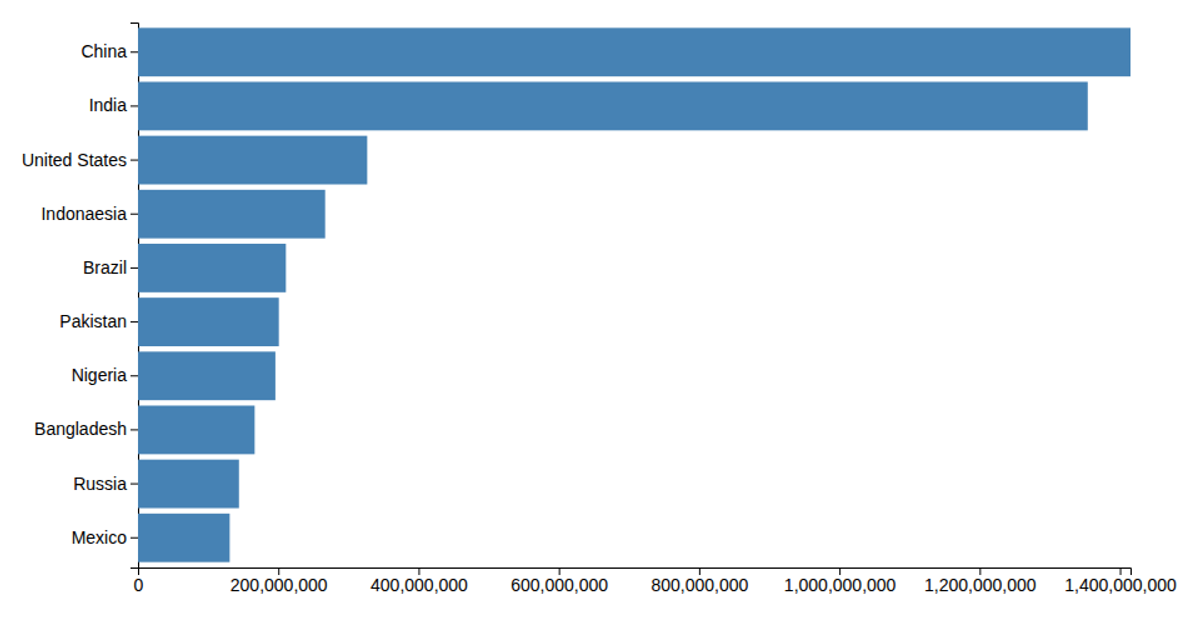
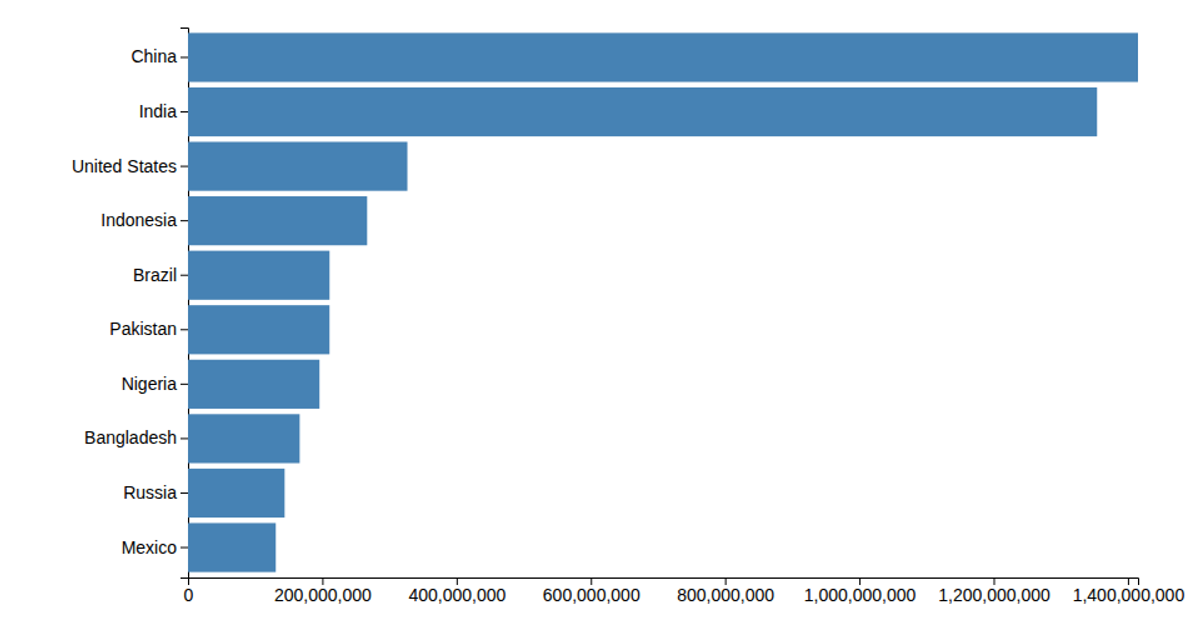
This horizontal bar chart compares the populations of ten countries, using a linear scale for population values and a band scale for country names. The visualization renders as SVG rectangles filled with steelblue, with axes generated via `axisLeft` and `axisBottom`. The code loads data from a CSV file, multiplies each population value by 1,000, and applies a margin-based layout using `scaleLinear`, `scaleBand`, and D3 v5’s `select` and `csv` methods.
AI-generated descriptionMIT Licensed





Comments
Sign in to join the discussion.