🌍 Public
lalith_act6-T4-Q1
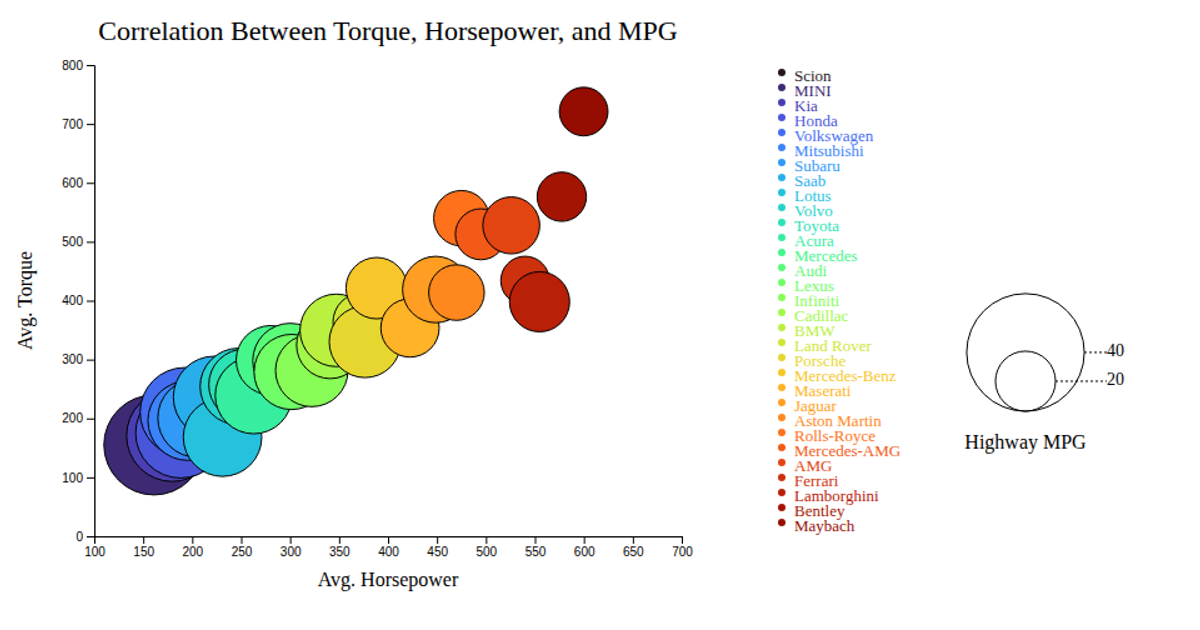
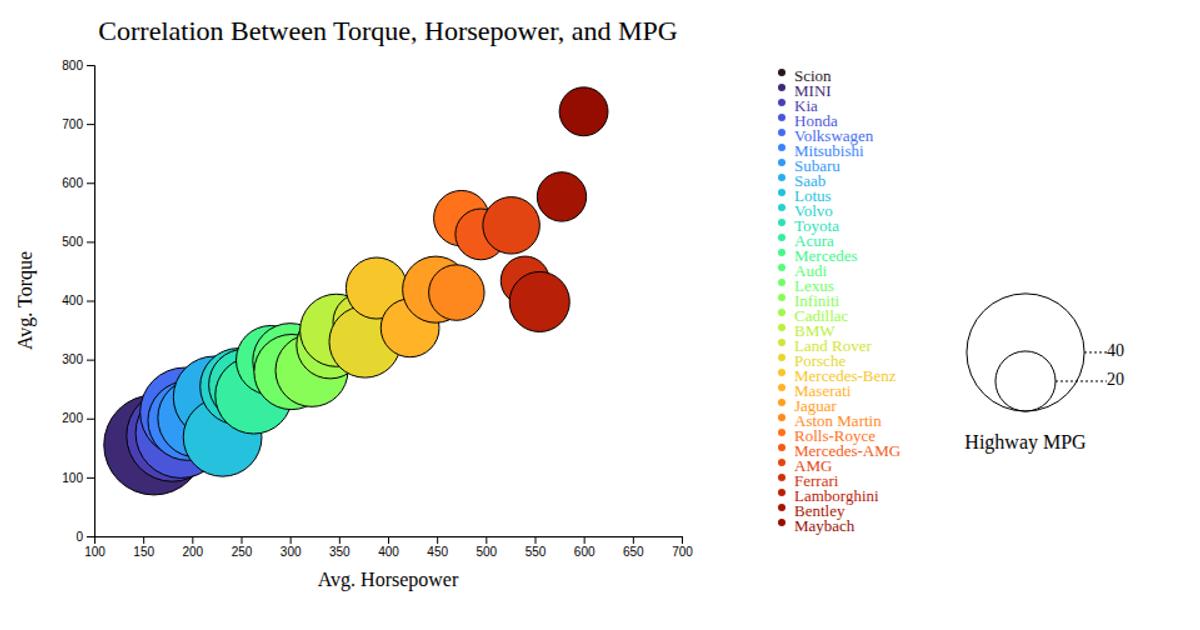
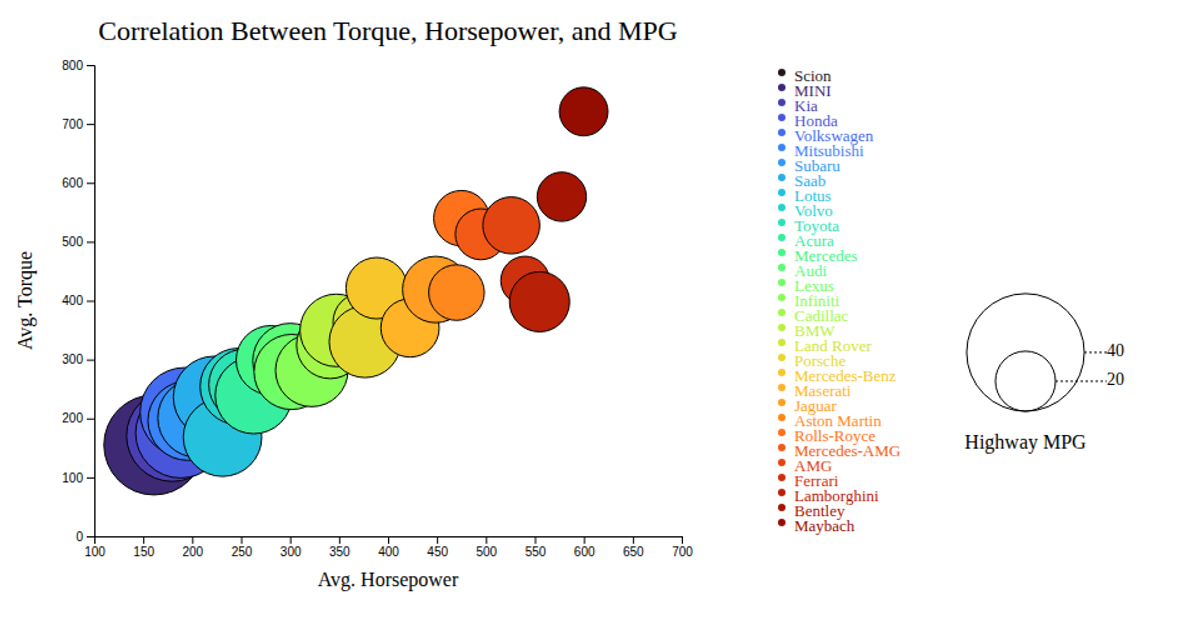
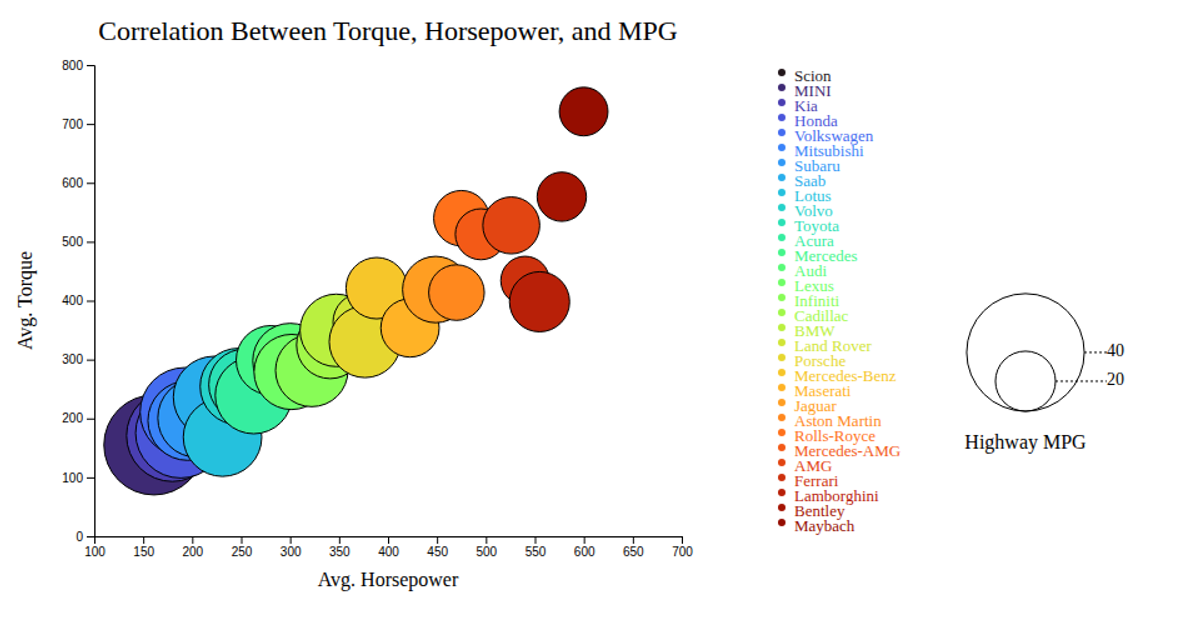
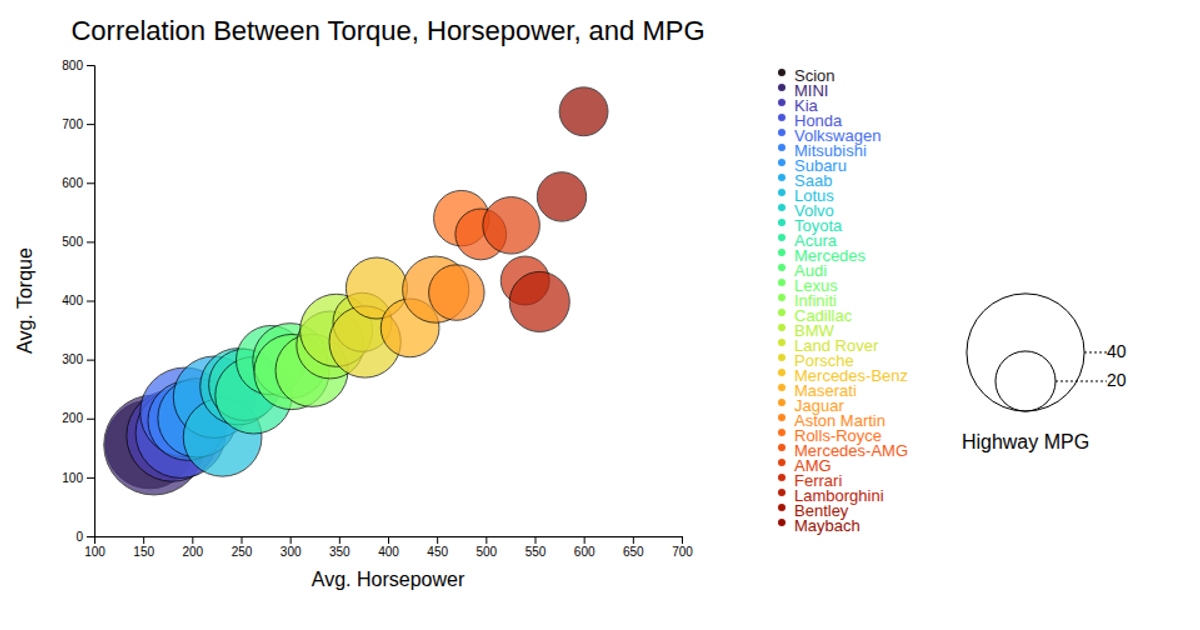
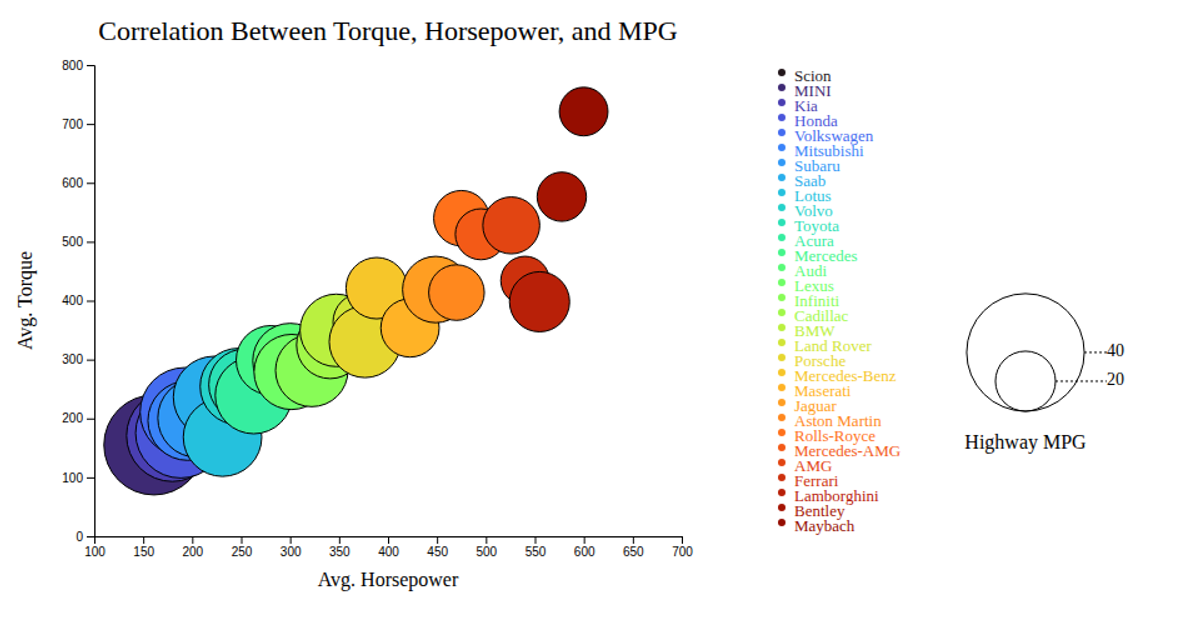
This bubble chart visualizes the correlation between average horsepower, torque, and highway MPG across motorcycle makes, with each circle’s position encoding the first two variables and its radius representing fuel efficiency. The tooltip reveals the make on hover. Built with d3.v7, it uses `scaleLinear` for axes and bubble sizing, `scaleOrdinal` with `interpolateTurbo` for color, and SVG circles with mouse event handlers. A legend shows MPG values and color-coded makes. Data comes from `bubblechart.csv`.
AI-generated descriptionMIT Licensed


Comments
Sign in to join the discussion.