🌍 Public
Fork of Pooja's ICE-6
PPoojaThandra
Last edited Mar 6, 2023
Created on Mar 6, 2023
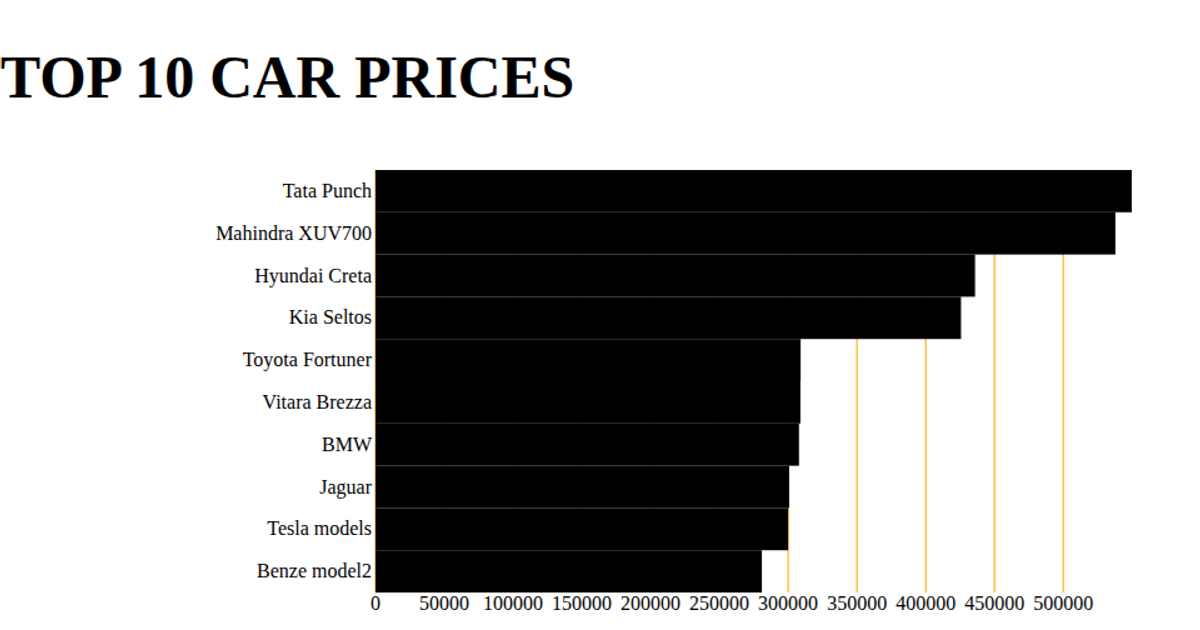
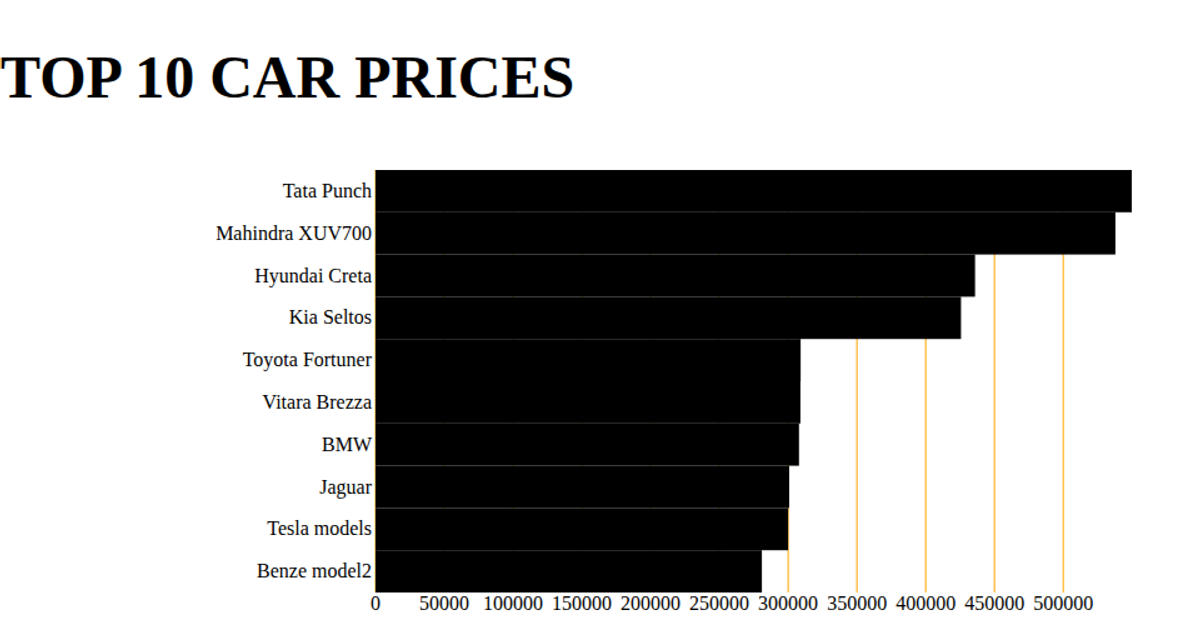
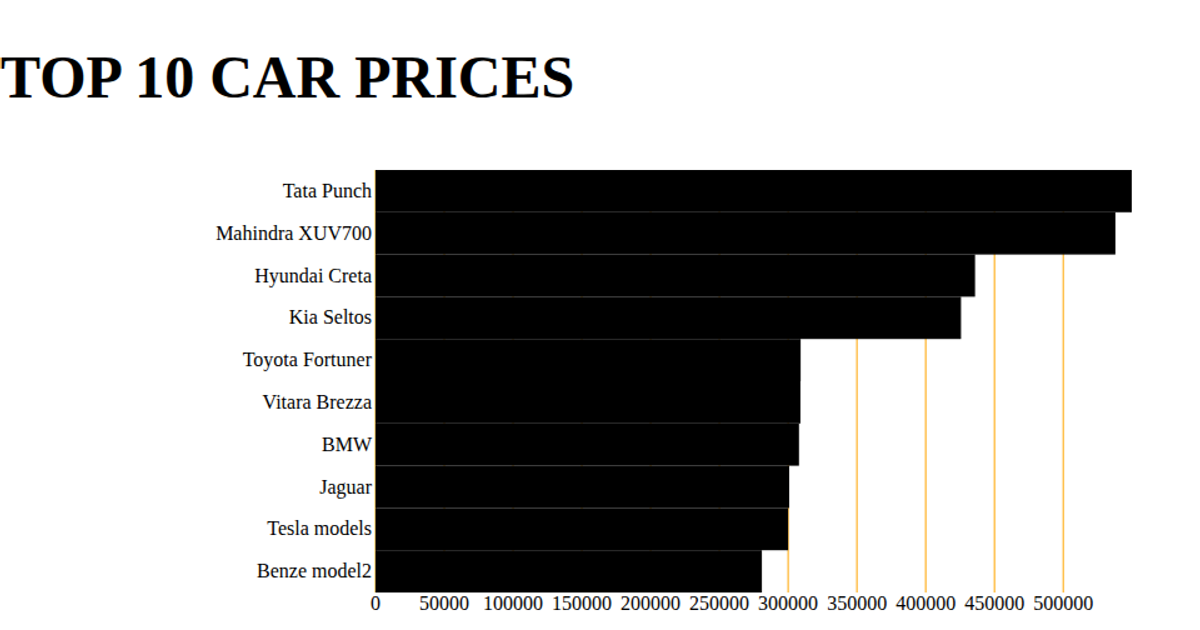
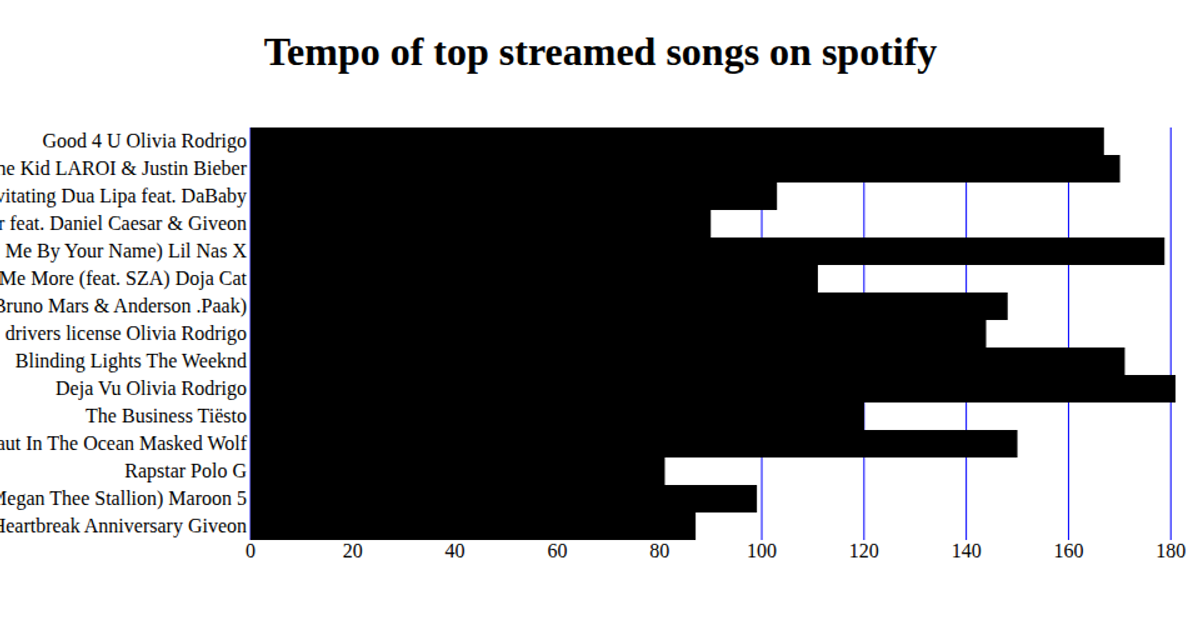
This bar chart displays the average on-time performance (Time) for the top ten airlines, sourced from a CSV file of diamond pricing data. Built with React and D3 v5, it uses `scaleBand` for the categorical y-axis and `scaleLinear` for the numerical x-axis. SVG rectangles are rendered with the `d3.csv` loading and React’s `useState`/`useEffect` hooks, with axes drawn using `d3.axisBottom` and `d3.axisLeft`.
AI-generated descriptionA bare minimum HTML page.
MIT Licensed



Comments
Sign in to join the discussion.