🌍 Public
Activity6_Task4
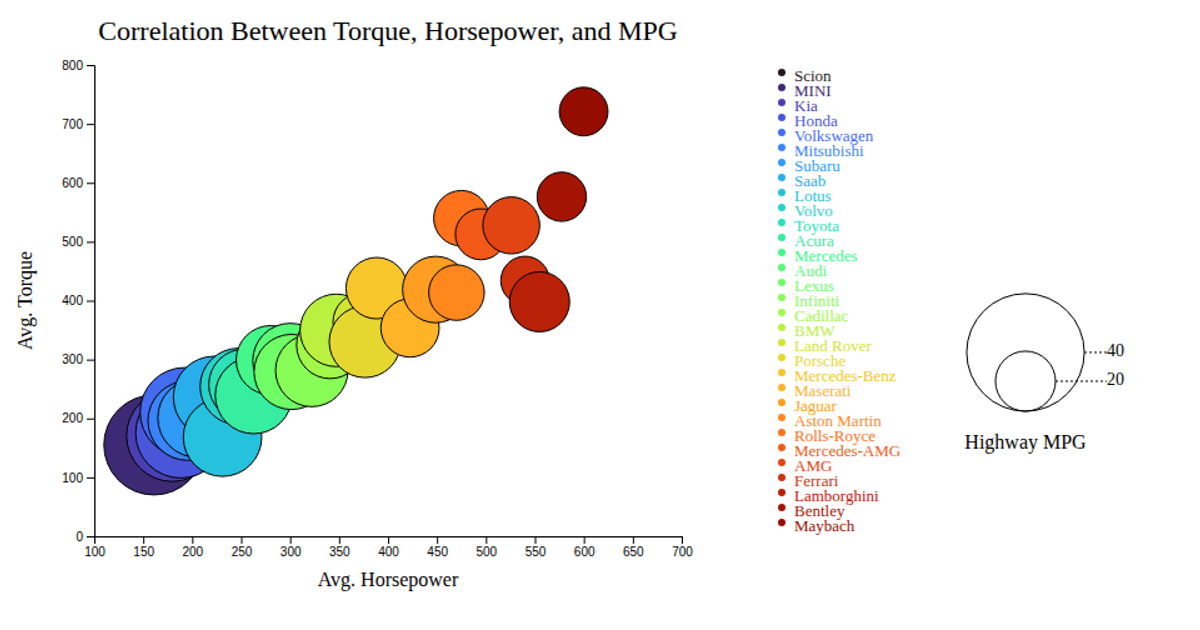
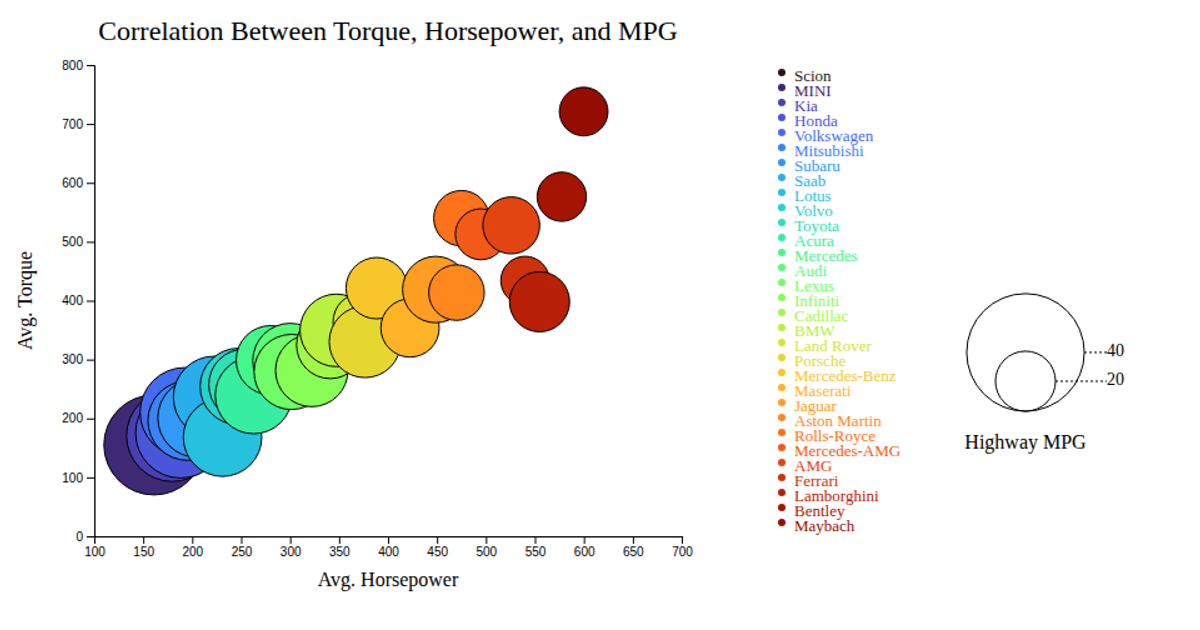
This bubble chart visualizes the correlation between average horsepower, torque, and highway MPG across various car makes. It reveals a general trend where vehicles with higher horsepower and torque tend to have lower fuel efficiency. The visualization uses D3.js to render an interactive SVG, with bubble size representing highway MPG and color encoding the car make. Hovering over a bubble triggers a tooltip displaying the make name, implemented using D3 event handlers.
AI-generated descriptionMIT Licensed


Comments
Sign in to join the discussion.