🌍 Public
Activity_6_Task_3
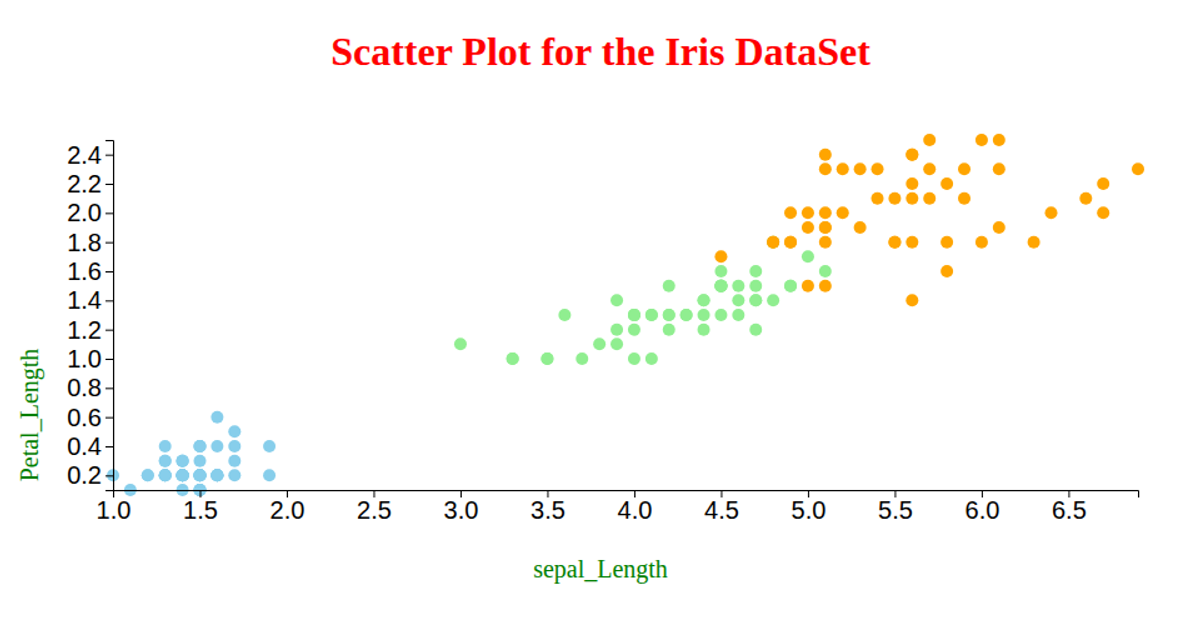
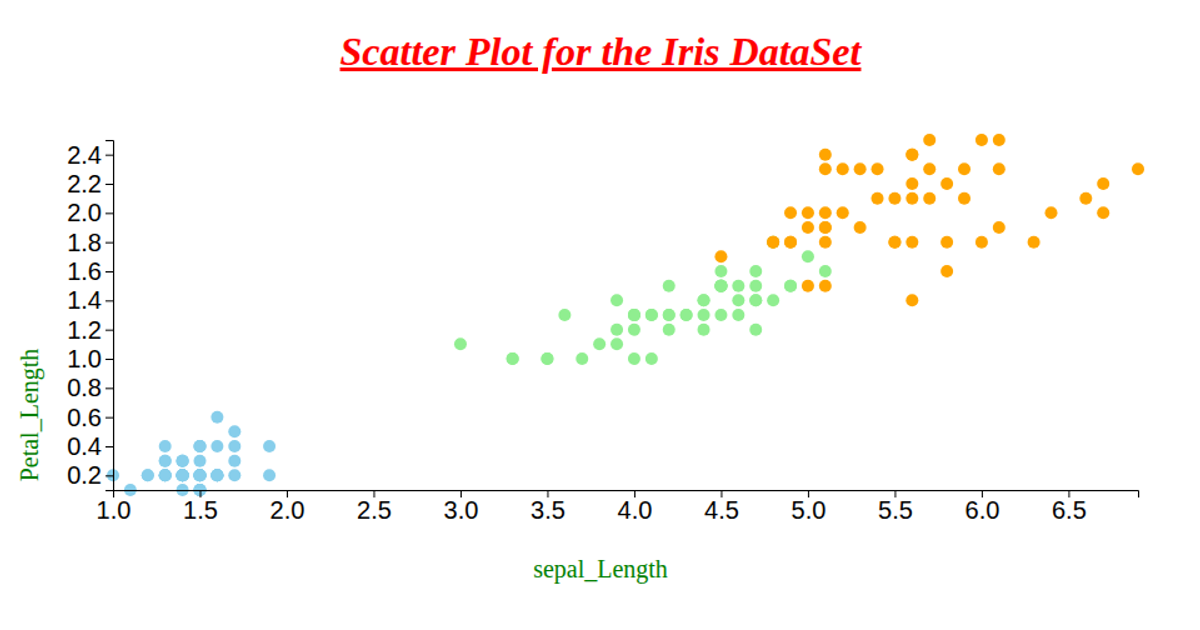
This scatter plot visualizes the Iris dataset, showing the relationship between petal length and petal width, with each point colored according to the flower's species. The visualization uses D3 v6, specifically leveraging the `csv`, `select`, `scaleLinear`, and `extent` functions to load and scale the data, and rendering with SVG circles. Axis labels are added using `axisLeft` and `axisBottom`, with the chart's dimensions adapting to the browser window.
AI-generated descriptionAn example showing the capabilities of VizHub:
- Loads D3 via UNPKG.
- Demonstrates use of
importfrom"d3". - Demonstrates use of
importfrom local ES6 modules.
MIT Licensed



Comments
Sign in to join the discussion.