🌍 Public
Fault Tree
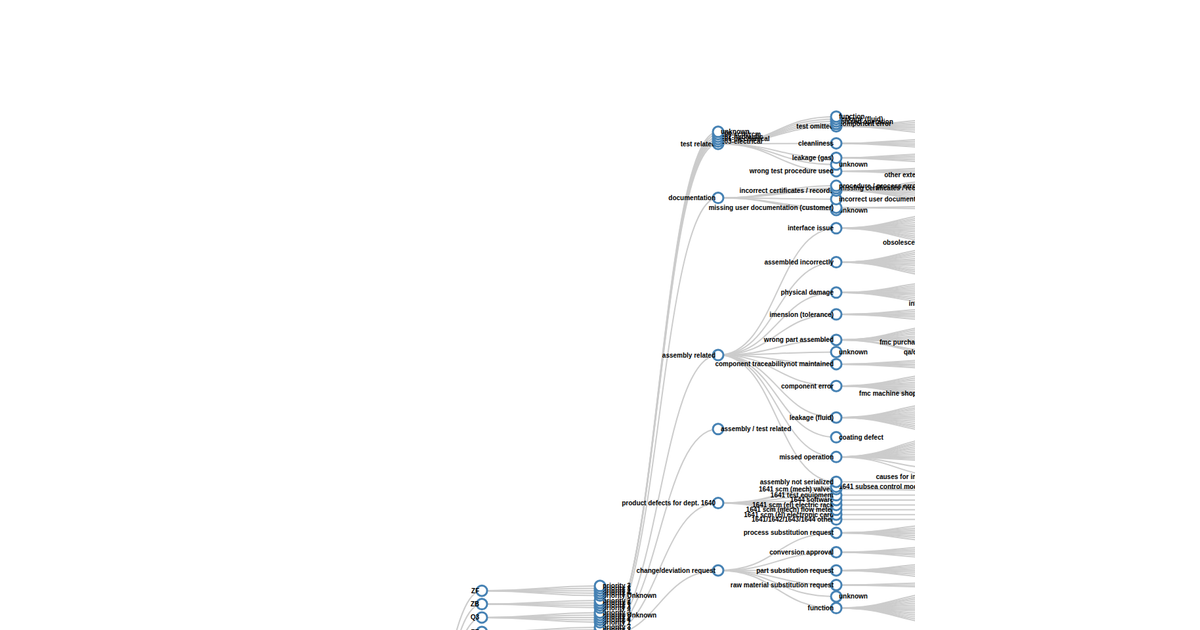
This interactive fault tree diagram uses GoJS 2.1.2 to display a hierarchical reliability structure, with each non-root node shaped as an AND gate, OR gate, circle, or triangle based on its fault condition. The TreeLayout arranges nodes vertically at 30-pixel layer spacing, while the sample data loads from an embedded JSON model. Nodes use gradient fills via a figure converter, and orthogonal links with 20-pixel curviness connect parent and child elements. The diagram supports tree dragging, undo/redo, and saving the modified model back to JSON.
AI-generated descriptionAn example showing the capabilities of VizHub.
MIT Licensed






Comments
Sign in to join the discussion.