🌍 Public
scatterplot
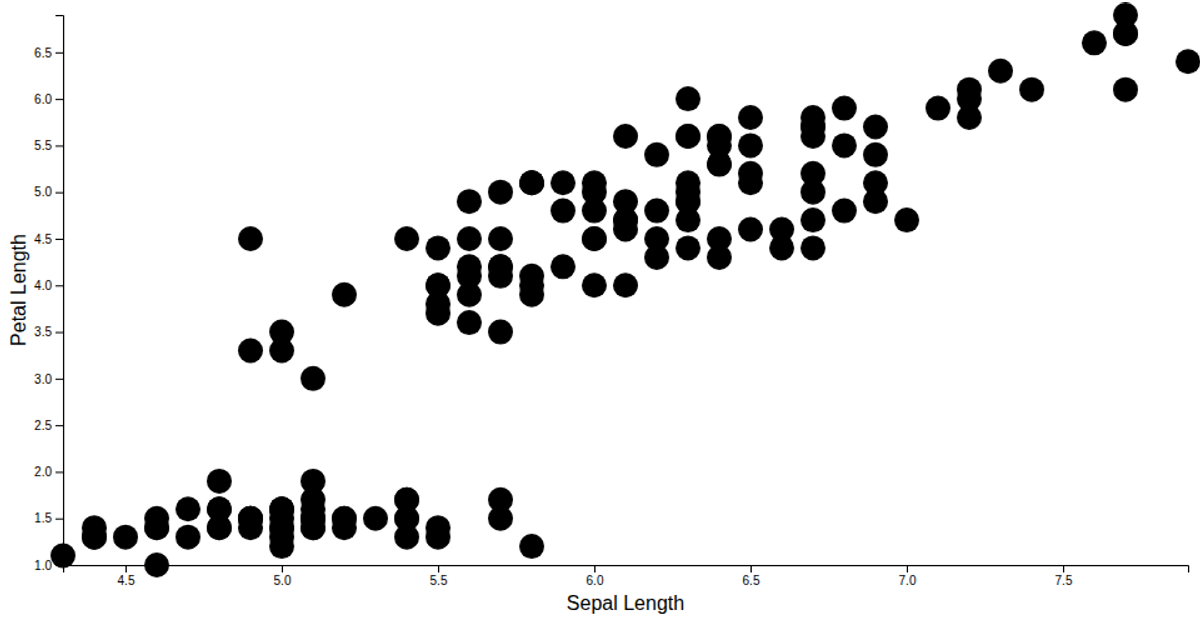
This D3.js v7 scatter plot visualizes the Iris Dataset, plotting sepal length against petal length for 150 flowers. The chart uses `scaleLinear` to map the continuous measurements and `axisLeft`/`axisBottom` from D3 for labeled axes. Data is loaded from a CSV file via `fetch` and parsed with `csvParse`. Points are rendered uniformly without encoding the species variable, though the dataset includes three iris species. The plot updates responsively to fill the browser window.
AI-generated descriptionA scatter plot of the Iris Dataset.
MIT Licensed



Comments
Sign in to join the discussion.