🌍 Public
5th visualisation
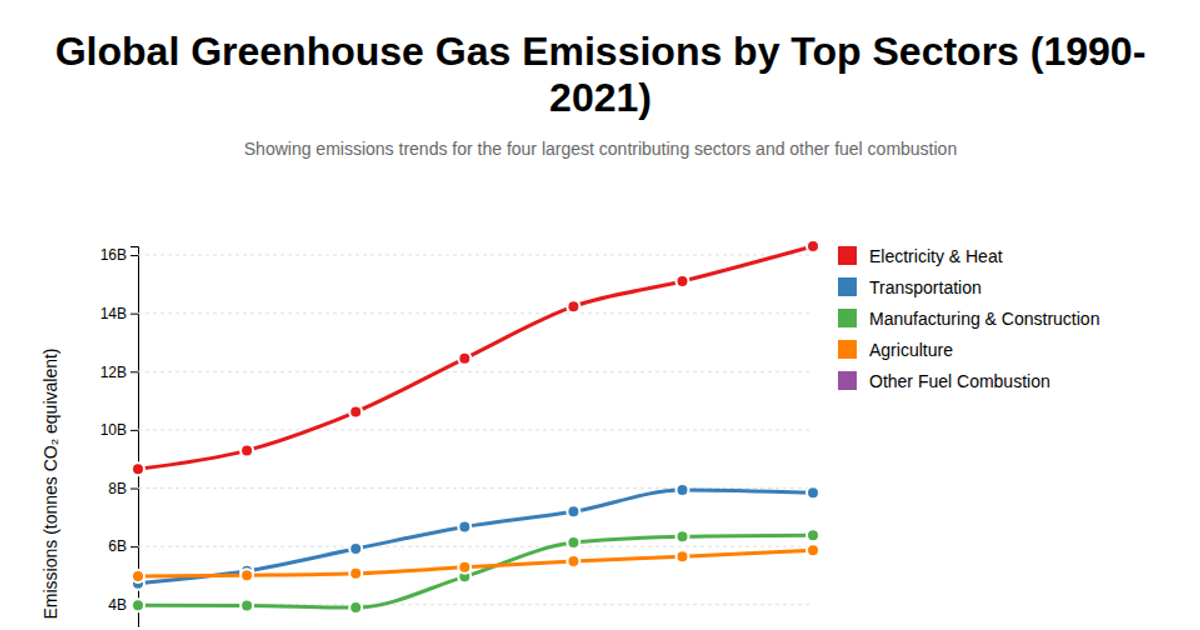
A responsive line chart visualizes mean greenhouse gas emissions per year, averaged across the dataset and colored by year. It uses d3.csv to load the data, d3.group and d3.mean for aggregation, and d3.line to generate paths. SVG axes, scales, and a legend are built with d3.scaleTime, d3.scaleLinear, and d3.axisBottom/Left. The source is an integrated CSV from a GitHub repository.
AI-generated descriptionA responsive scatter plot.
MIT Licensed







Comments
Sign in to join the discussion.