🌍 Public
ICE-7 Pie Chart
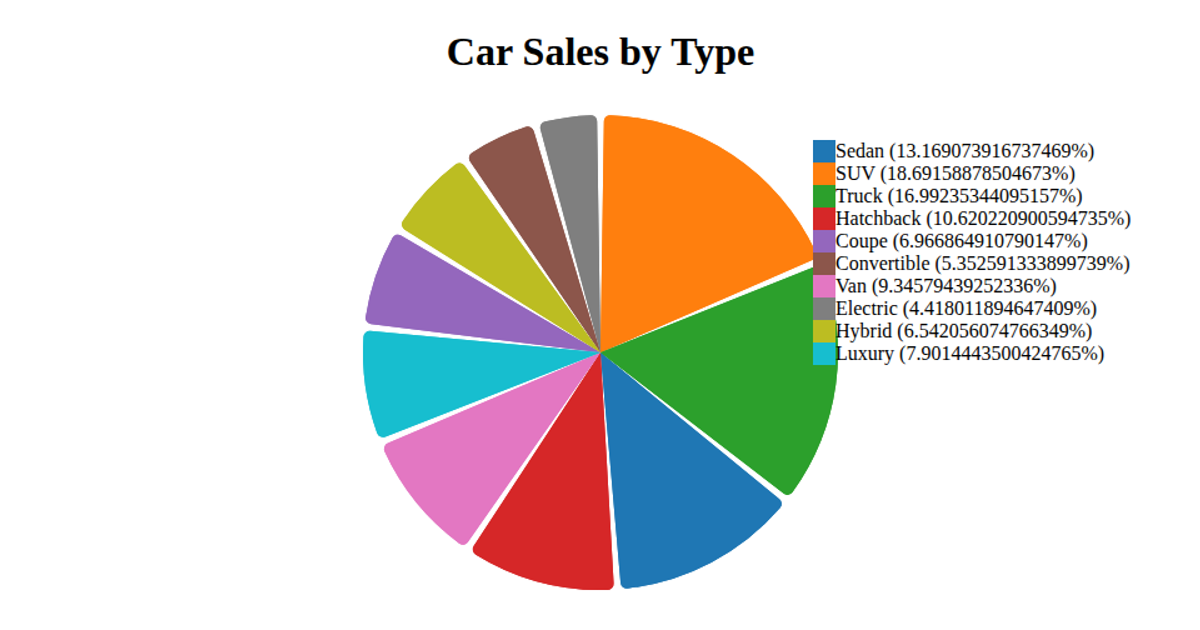
This example visualizes car sales by sales representative as a pie chart, with each slice representing the proportion of total sales amount attributed to a specific rep. The chart displays sales rep names and their corresponding sales percentages in a legend. The visualization loads CSV data from a GitHub repository using `d3.csv` and renders the pie chart with SVG paths. It uses `d3.pie` and `d3.arc` to generate the slices, `d3.scaleOrdinal` to assign distinct colors, and `d3.format` to display percentages. The legend is manually positioned using SVG groups and text elements.
AI-generated descriptionMIT Licensed



Comments
Sign in to join the discussion.