🌍 Public
Fork csv data
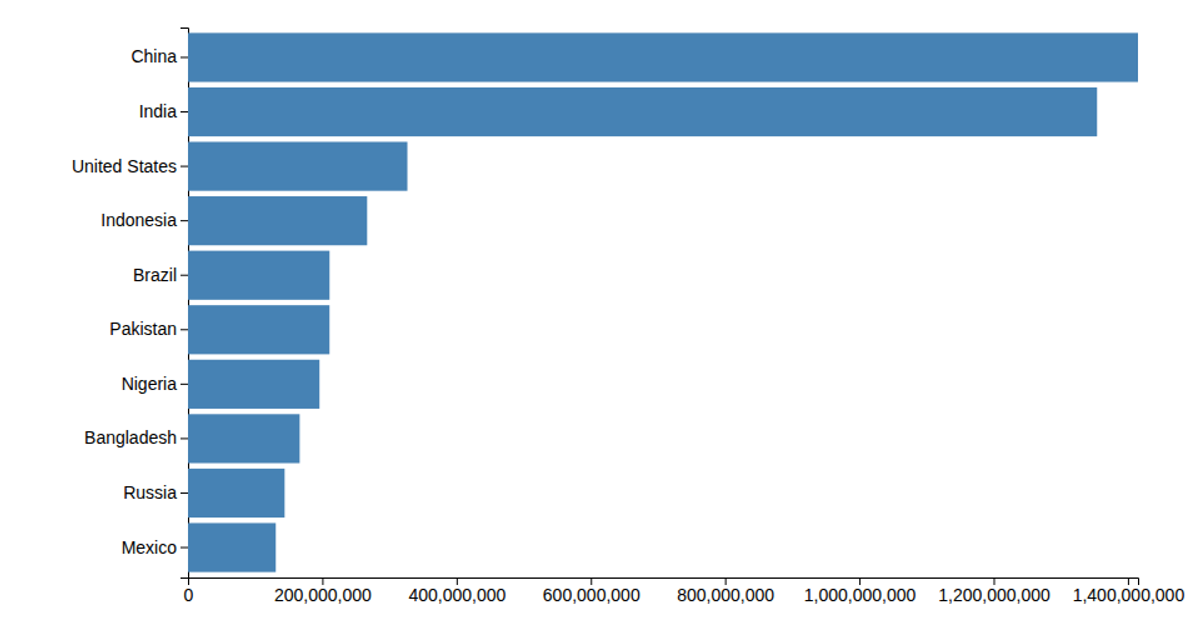
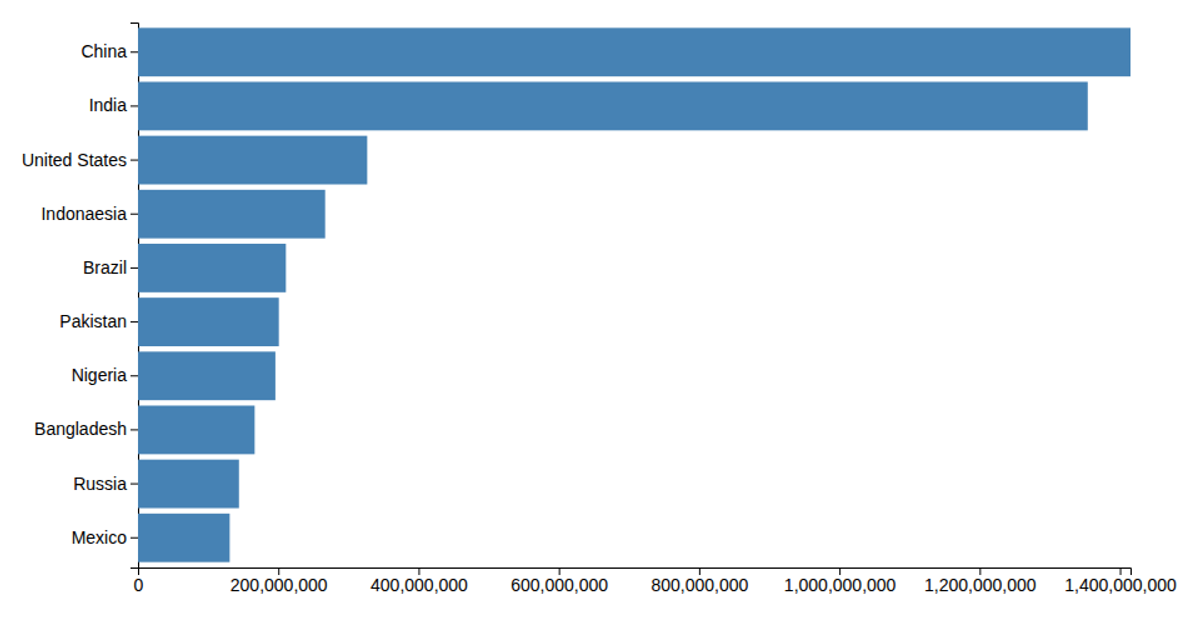
A bar chart visualizes population growth per year from a small CSV dataset, with red rectangles representing values and a 24-pixel text label reading "XYZ Foods Stock Price." The chart uses D3 v5 to load the data via `d3.csv`, parse population values as numbers, and render SVG rectangles. Scales are created with `d3.scaleLinear` for the x-axis and `d3.scaleBand` for the y-axis, though the width and height attributes are set directly from raw data values, resulting in a sparse, incomplete layout.
AI-generated descriptionMIT Licensed




Comments
Sign in to join the discussion.