🌍 Public
Fork of D3 Scatterplot (Dynamic)
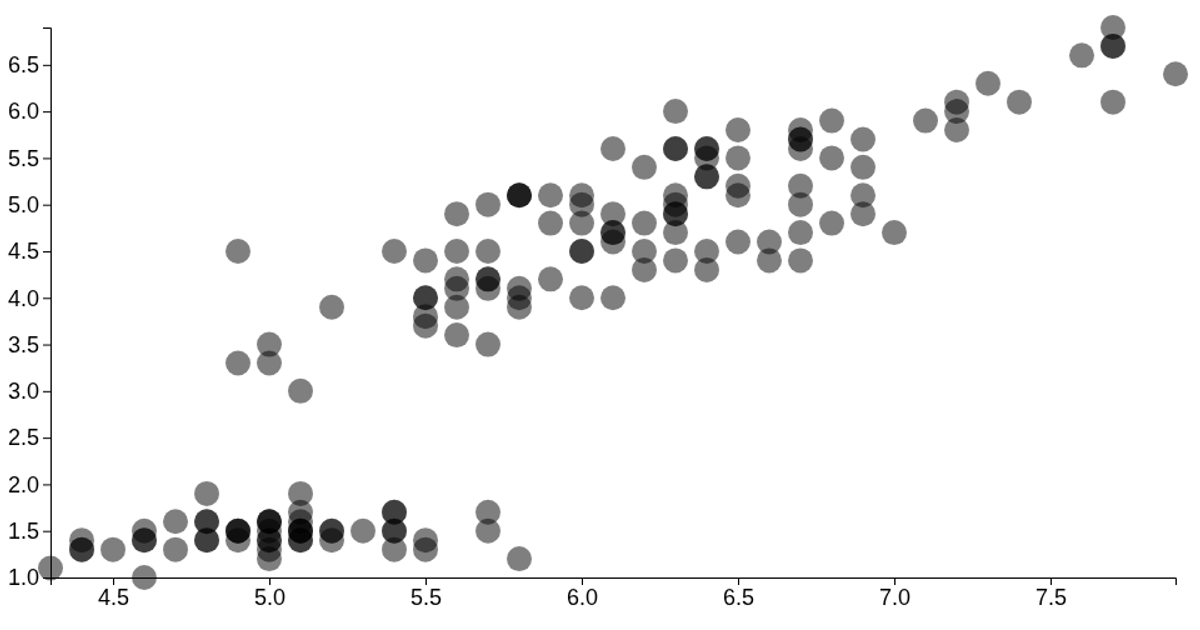
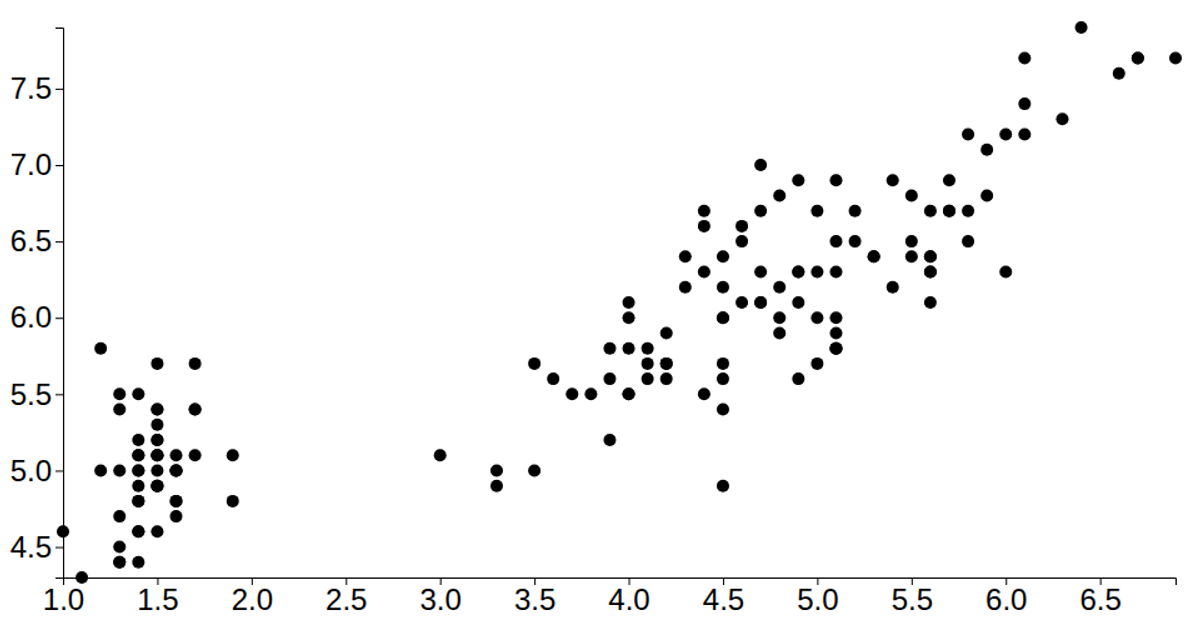
This interactive scatterplot displays the Iris dataset, plotting petal length against sepal length for individual flowers. The visualization is rendered as SVG and constructed with D3 version 7, using `scaleLinear` for axes, `axisLeft` and `axisBottom` for ticks, and a reusable `scatterPlot()` function following the getter-setter pattern. Data is loaded via `d3.csv` from a remote GitHub gist, with parsing converting string values to numbers. Circles are drawn with configurable radius, fill color, and opacity, accompanied by rotated axis labels for clarity.
AI-generated descriptionMIT Licensed




Comments
Sign in to join the discussion.