🌍 Public
Customising numbers
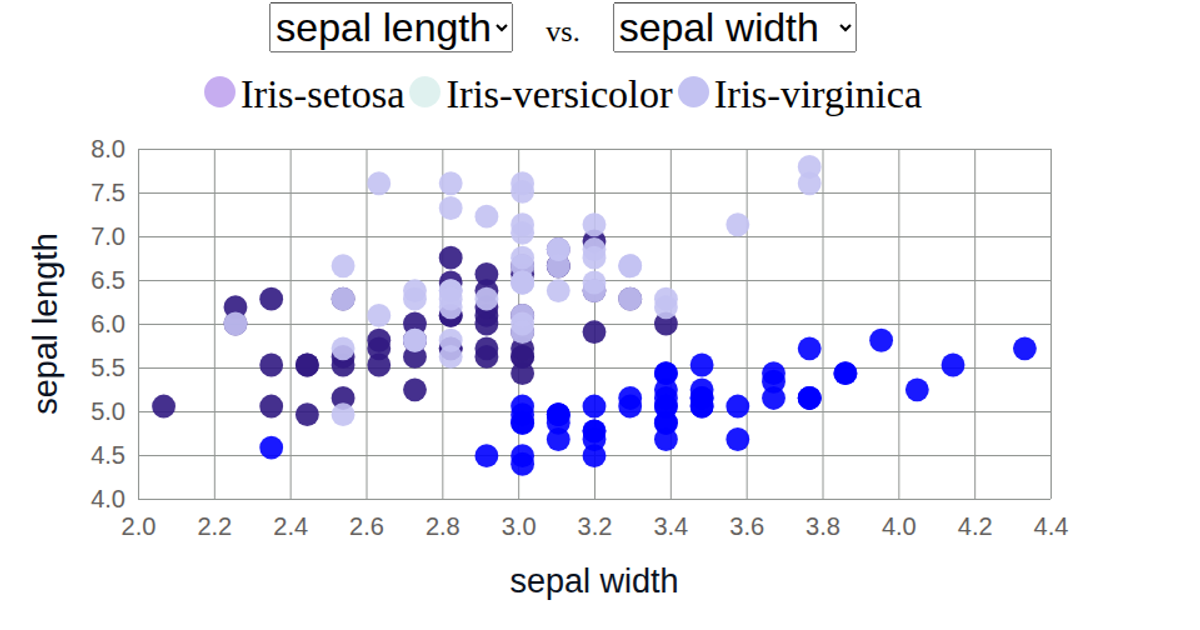
This example demonstrates interactive selection in a small multiples-style scatter plot. It displays iris flower measurements from a CSV file, using D3.js to map sepal length to the x-axis and petal length to the y-axis, with each species represented by a distinct colored dot. A brushing interaction lets users drag a rectangular selection over the plot; the code uses D3’s brush API and event handling to apply a CSS class that highlights selected points within the brushed area, while unselected points remain dimmed.
AI-generated descriptionMIT Licensed




Comments
Sign in to join the discussion.