🌍 Public
Linked Views
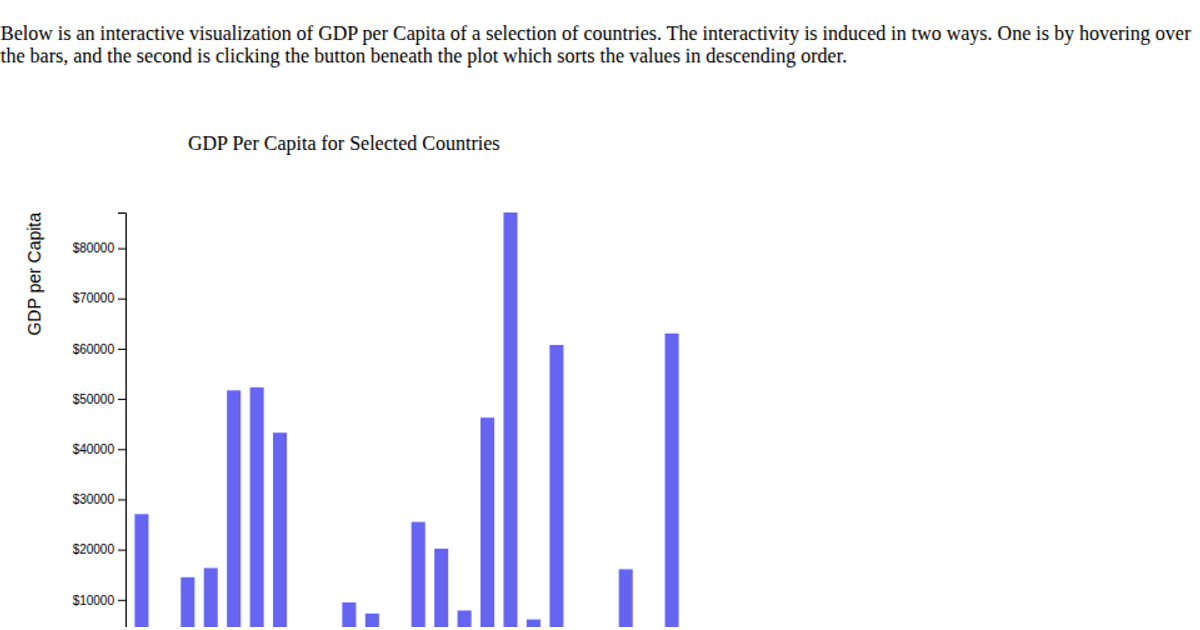
A simple bar chart displays GDP by country from a CSV file, using D3 v6 to bind data to SVG rectangles. Hovering over a bar reveals a tooltip showing the country name, following the cursor's position via mouse events. The chart uses scaleBand and scaleLinear for x and y axes, with a fixed width and height. Clicking or interacting with bars updates the tooltip dynamically, demonstrating linked views between data and visual feedback.
AI-generated descriptionA bare minimum HTML page demonstrating use of CSS and JavaScript.
See also React Starter.
MIT Licensed




Comments
Sign in to join the discussion.