🌍 Public
Organisation Network Graph
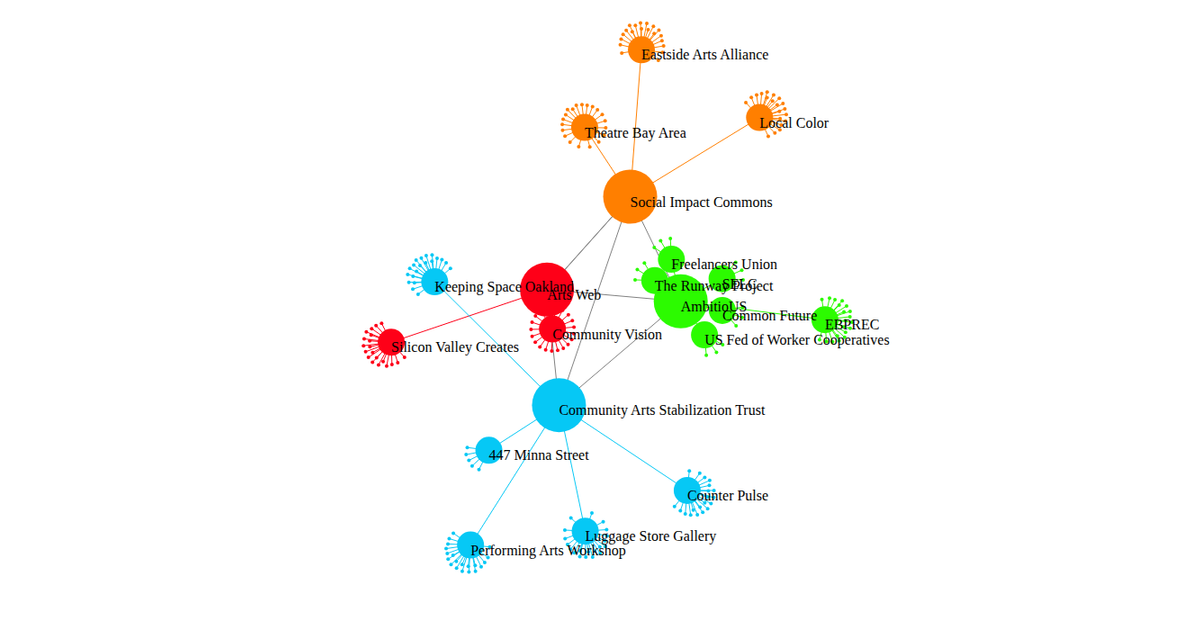
This example displays an organization network graph, visualizing the relationships between teams and tools. Larger hub nodes represent main departments, while smaller connected nodes show their related sub-teams or platforms, with colors grouping different functional areas. The graph uses D3’s force simulation (`d3.forceSimulation`, `forceManyBody`, `forceLink`, `forceCenter`) to position nodes and links dynamically. Nodes are rendered as SVG circles with labels, and links as lines, with drag interaction applied via `d3.drag` on the simulation.
AI-generated descriptionMIT Licensed




Comments
Sign in to join the discussion.