🌍 Public
Fork of Sequences sunburst
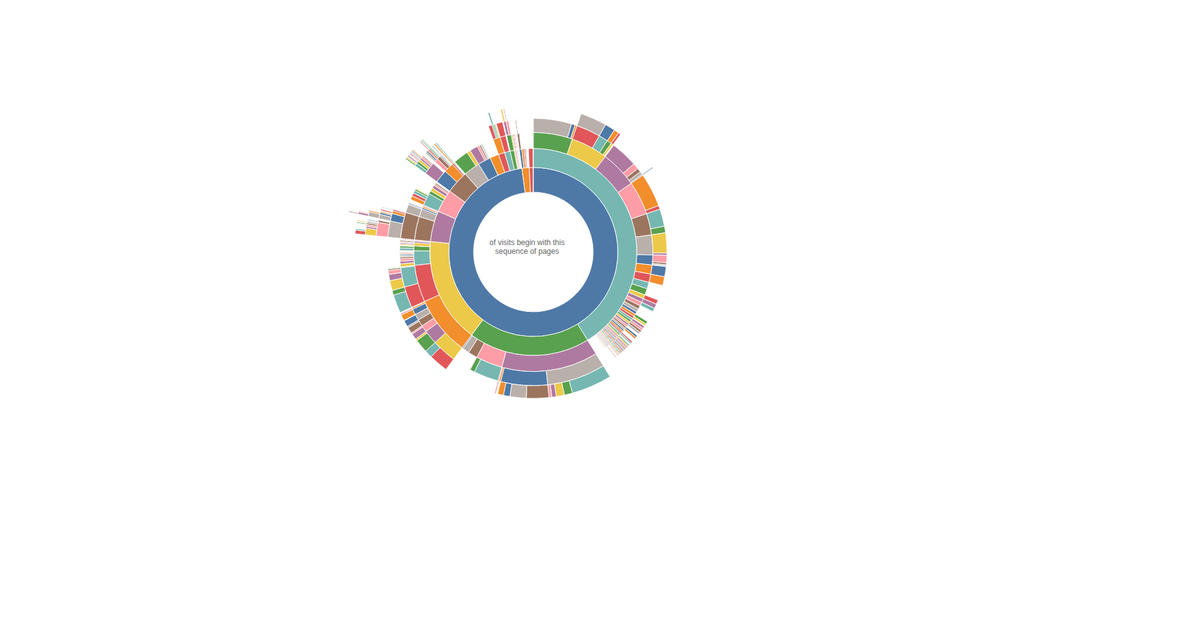
This interactive sunburst diagram displays a game’s asset hierarchy, showing the proportional size of each category and its subcategories. Hovering over a segment highlights the path from the root, displays the percentage of the total, and updates a breadcrumb trail. Built with React and D3 v4, it loads CSV data via `d3.csvParseRows`, constructs a hierarchy with `d3.hierarchy` and `d3.partition`, and renders arcs using `d3.arc`. Colors are assigned using `d3.scaleOrdinal` with `d3.schemeTableau10`, and mouseover/mouseleave events control the highlighting and animation.
AI-generated descriptionA bare minimum HTML page.
See also React Starter.
MIT Licensed






Comments
Sign in to join the discussion.