🌍 Public
2.8 - Activity: Your first visualization!
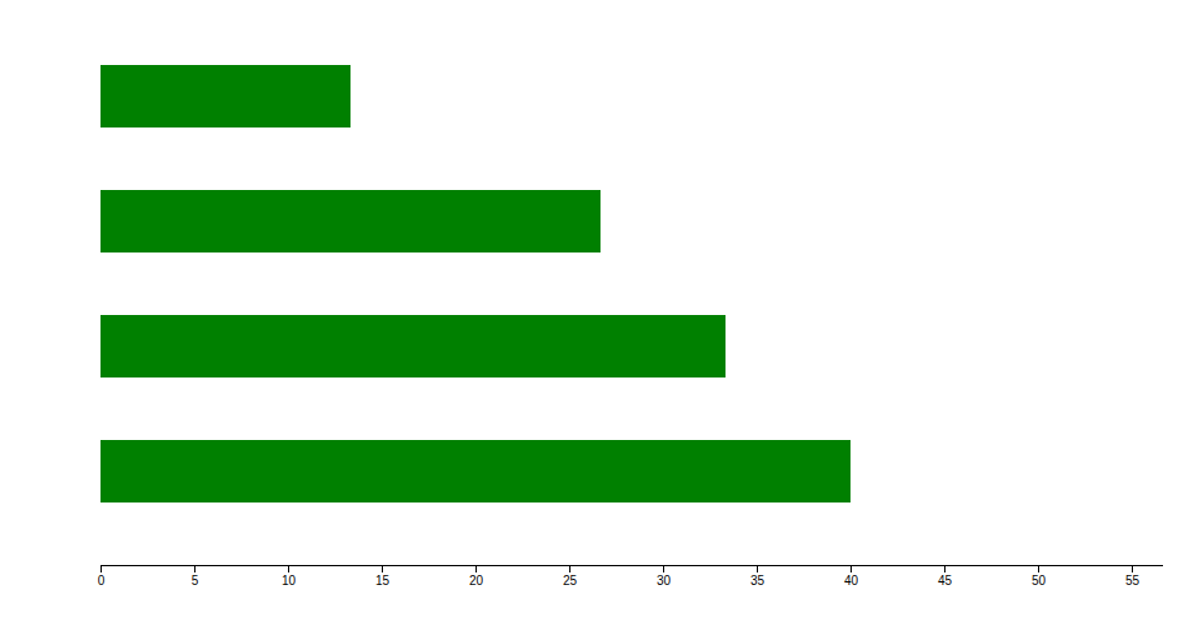
Five horizontal bars display the heights of five skyscrapers, loaded from a local JSON file and rendered as SVG rectangles. The visualization uses D3.js v5 with `d3.json` to fetch and parse the data, converting each height string to a number. Bars are appended to an SVG canvas with fixed dimensions, using `selectAll` and `enter` for data binding. Each rectangle’s height is mapped directly to the data value, with grey fills and uniform positioning along the x-axis.
AI-generated descriptionMIT Licensed





Comments
Sign in to join the discussion.