🌍 Public
Activity6_Task4
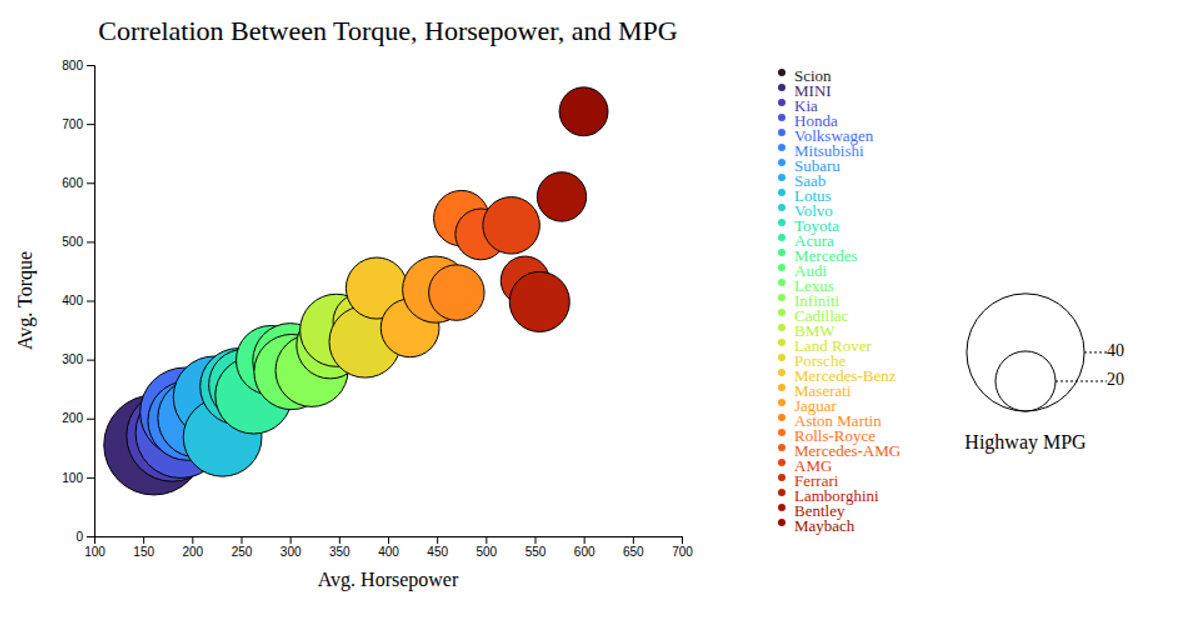
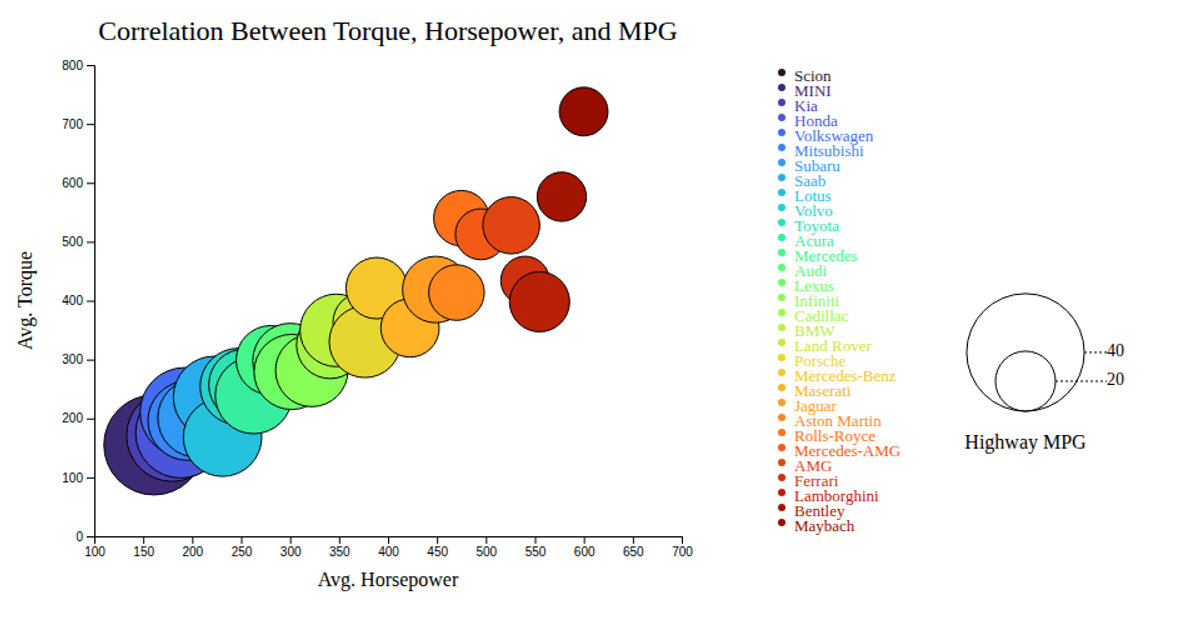
This animated bubble chart visualizes the correlation between average horsepower, torque, and highway MPG across car makes using a CSV dataset. D3.js v7 renders SVG circles scaled by MPG and colored with a turbo-scaled ordinal palette. Interactive tooltips appear on mouseover, while the legend displays both bubble size reference circles and color-coded make labels. The implementation uses d3.csv, scaleLinear, scaleOrdinal, and event handlers for hover interactions.
AI-generated descriptionAn example showing the capabilities of VizHub:
- Loads D3 via UNPKG.
- Demonstrates use of
importfrom"d3". - Demonstrates use of
importfrom local ES6 modules.
MIT Licensed




Comments
Sign in to join the discussion.