🌍 Public
Making a Bar Chart
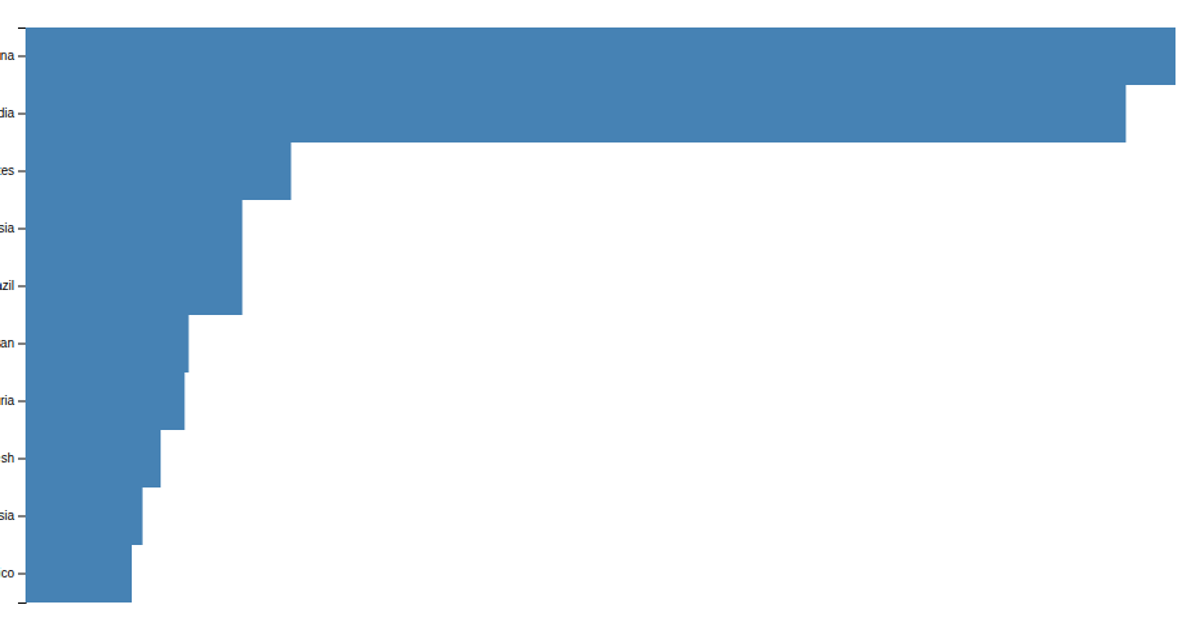
A bar chart displays population counts for ten countries from a CSV file, with steel-blue bars on a blank SVG canvas. The example demonstrates a minimal D3 v5 workflow: `select` targets the SVG element, `csv` loads the data, and a data join appends rectangle elements sized by population. This code focuses on the essential steps of reading external data and creating basic geometric marks.
AI-generated descriptionMIT Licensed




Comments
Sign in to join the discussion.