🌍 Public
Sol LeWitt Reproduction with D3
SSami Kauhanen-Duac
Last edited Jul 22, 2022
Created on Jul 22, 2022
Forked from my take of Sol LeWitt Reproduction with D3
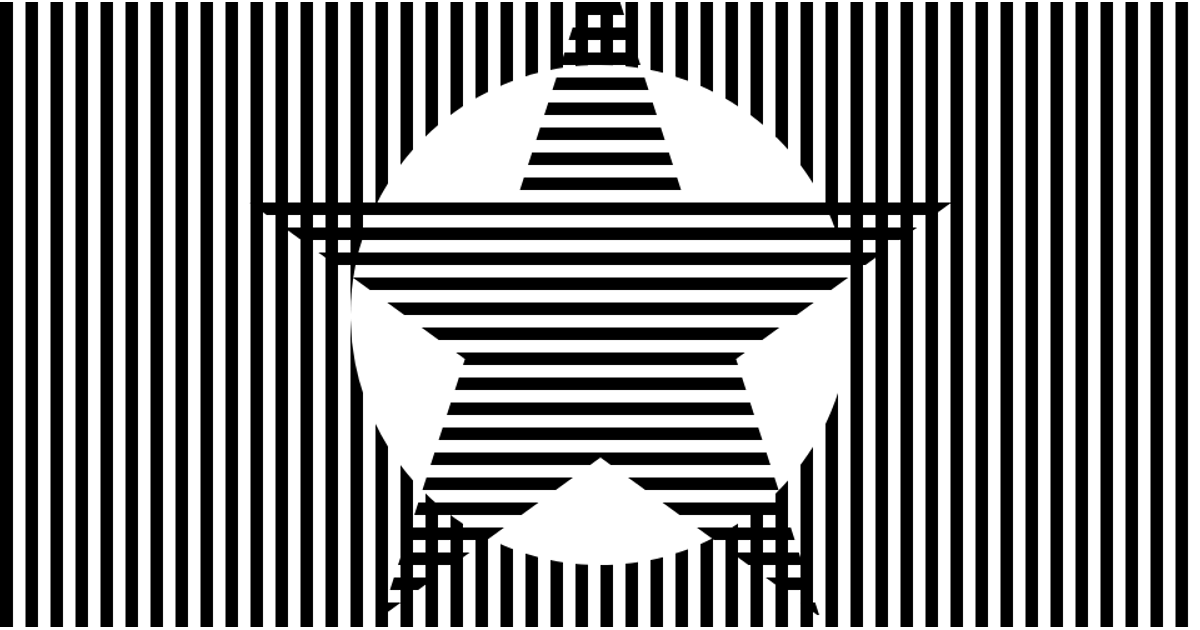
This example reproduces a Sol LeWitt art piece by layering thirteen colorful star-shaped symbols, each rendered as an SVG path and centered on the screen. The stars shrink in size as their index increases, creating a concentric, geometric pattern. The visualization uses D3 v3’s `select`, `range`, `symbols`, and `symbol` APIs to generate the path data, with the SVG canvas sized to the full window. The color palette is hard-coded in an array, and the code includes commented-out experiments with masks and rects.
AI-generated descriptionA reproduction of a Sol LeWitt art piece.
MIT Licensed



Comments
Sign in to join the discussion.