🌍 Public
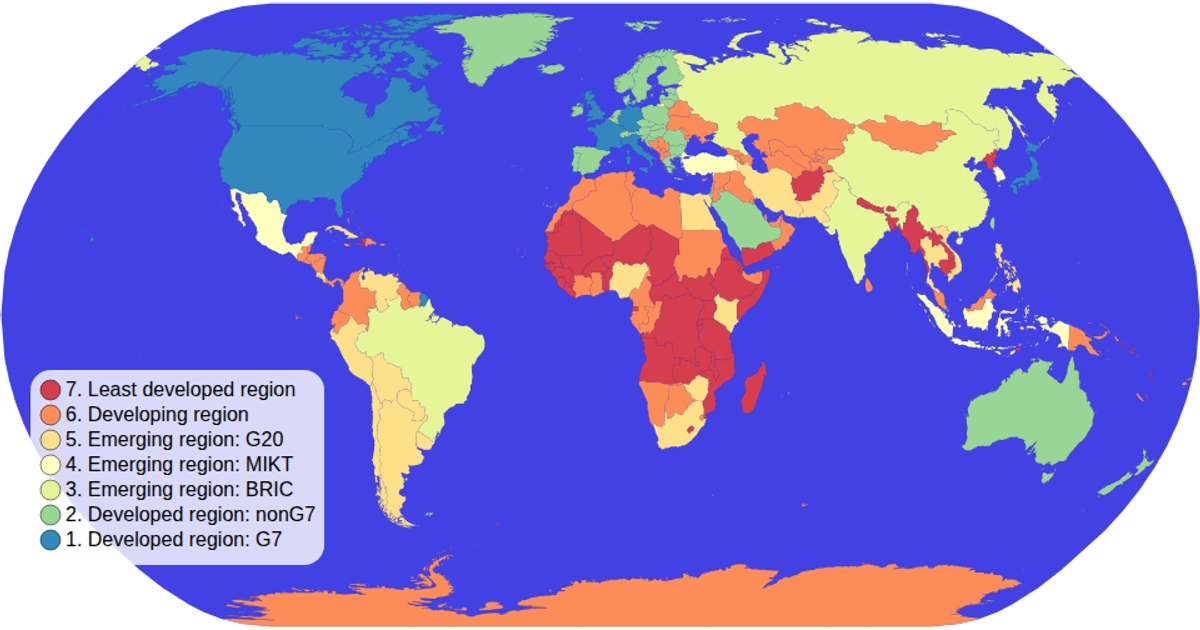
Choropleth Map with Interactive Filtering
EEdward-Elric233
Last edited Oct 28, 2020
Created on Sep 26, 2020
Forked from Choropleth Map with Interactive Filtering
This choropleth map visualizes countries colored by economic classification, with interactive filtering through a clickable legend that dims unselected regions. The map uses an equal-Earth projection via d3.geoPath and supports zooming through d3.zoom. World country boundaries come from TopoJSON, enriched with ISO codes from a TSV lookup. Selection updates path opacity and stroke-width, while the legend animates circle radii using transition().duration().
AI-generated descriptionMIT Licensed




Comments
Sign in to join the discussion.