🌍 Public
WACountiesEV_Fork of Simple Scatter Plot
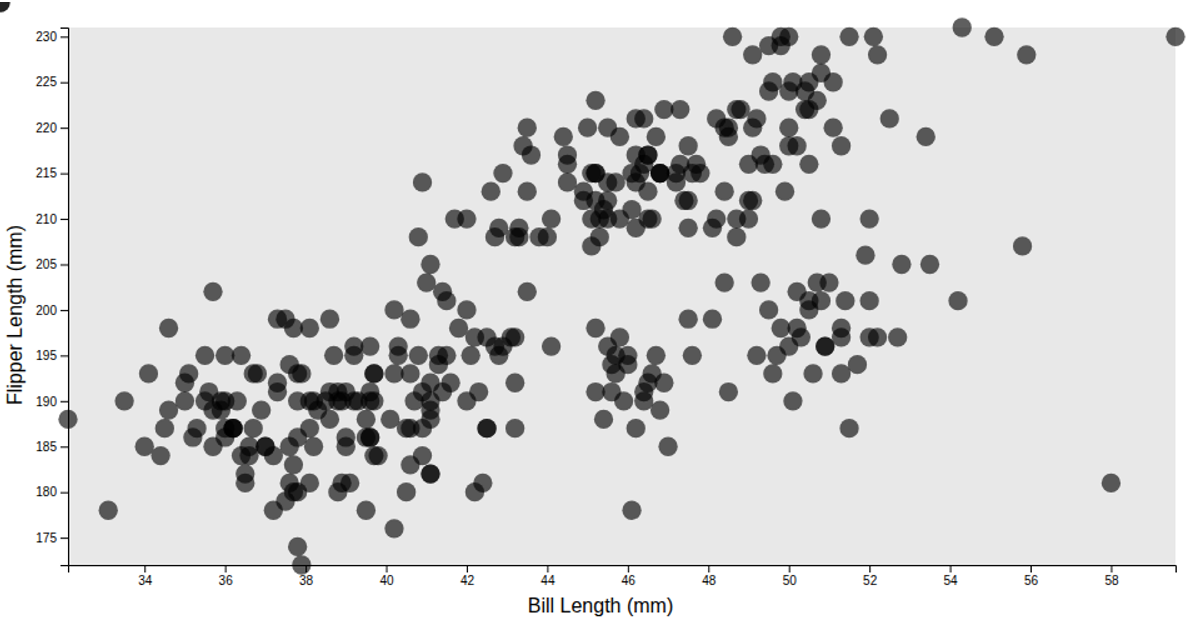
This scatter plot visualizes penguin measurements, displaying bill length on the x-axis and flipper length on the y-axis as semi-transparent circles over a gray inner rectangle. The visualization uses D3’s `scaleLinear` and `axisLeft` functions to map data from the `@curran/penguins` dataset to screen coordinates, with axes and labels rendered via the `@curran/axis-labels` library. The code imports `viz` from a separate module, which also handles drawing the axes, labels, and data points using D3’s `selectAll` and `join` patterns.
AI-generated descriptionA simple scatter plot with D3 showing the
MIT Licensed







Comments
Sign in to join the discussion.