🌍 Public
ICE-6: My Dataset with React & D3
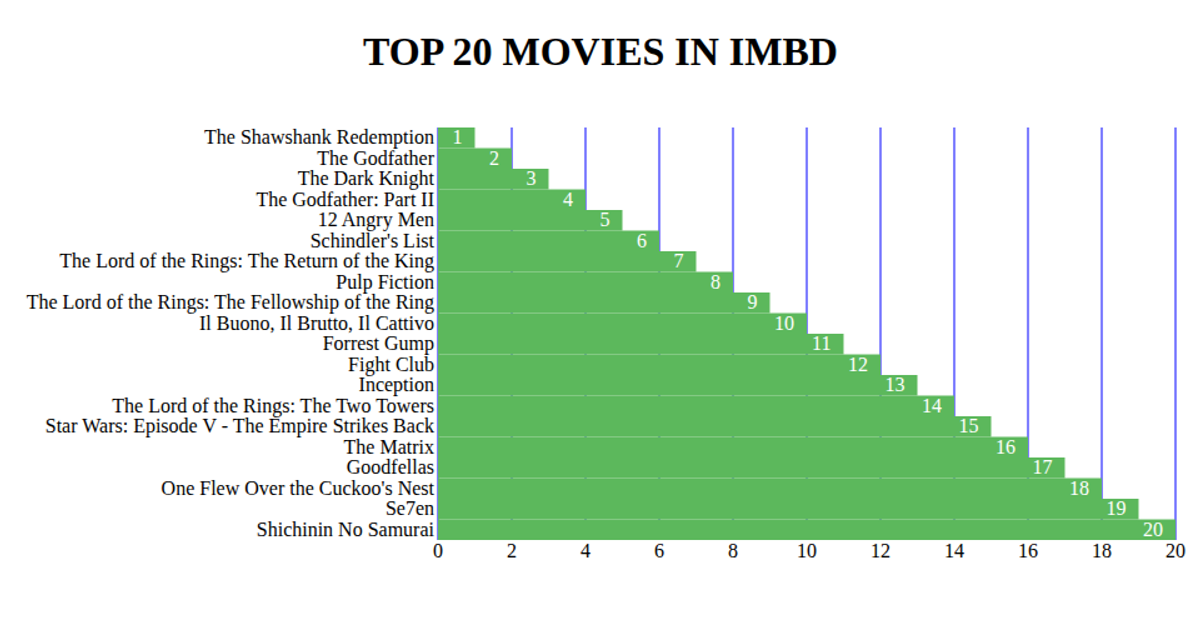
This example visualizes top-rated movies and their metascores using a React and D3.js setup. The page renders a dataset loaded from a CSV file hosted on GitHub Gist, displaying movie titles and their corresponding critic scores. The code imports D3’s `select` function from the `d3` module and uses it to manipulate the DOM, while a local ES6 module (`message.js`) demonstrates modular imports. D3 version 5.11.0 is loaded via UNPKG, and the visualization is embedded in a React-rendered `<div>` with styled HTML elements.
AI-generated descriptionAn example showing the capabilities of VizHub:
- Loads D3 via UNPKG.
- Demonstrates use of
importfrom"d3". - Demonstrates use of
importfrom local ES6 modules.
MIT Licensed




Comments
Sign in to join the discussion.