🌍 Public
Activity7_iris
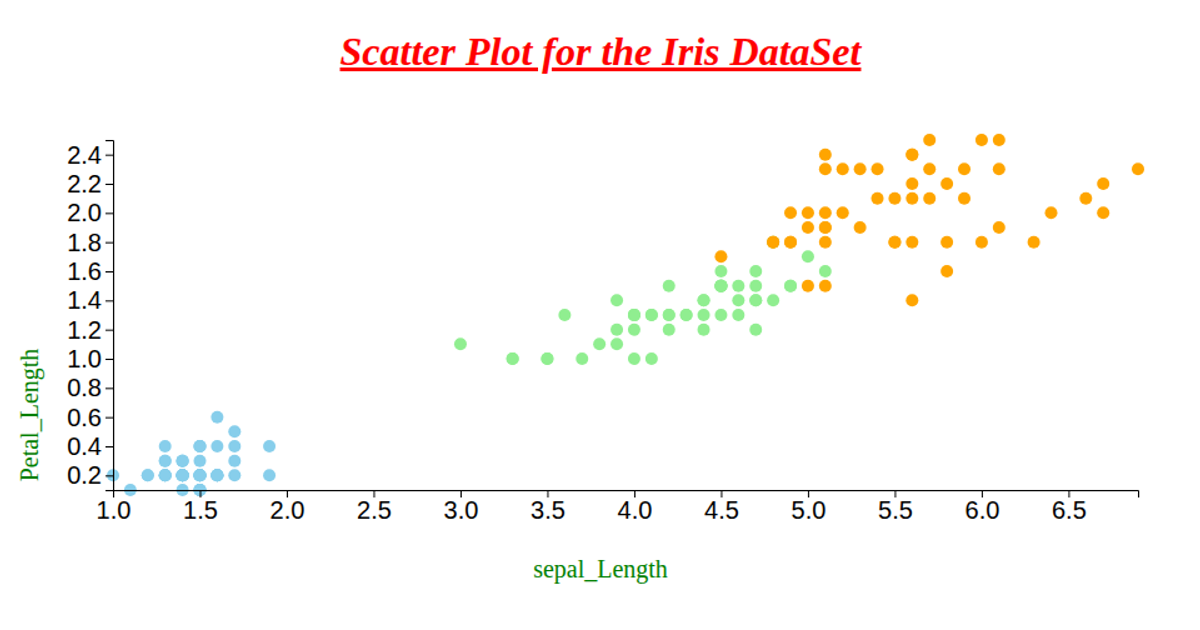
This example visualizes the classic Iris dataset, displaying the flower measurements in a large, centered text message. The visualization uses D3.js version 6 to select the message div and set its text content, importing a custom message from a local ES6 module. The data is rendered as plain text rather than through a graphical chart, relying on D3's `select` API to manipulate the DOM and apply CSS styling for presentation.
AI-generated descriptionMIT Licensed




Comments
Sign in to join the discussion.