🌍 Public
Ford stock prices for one week
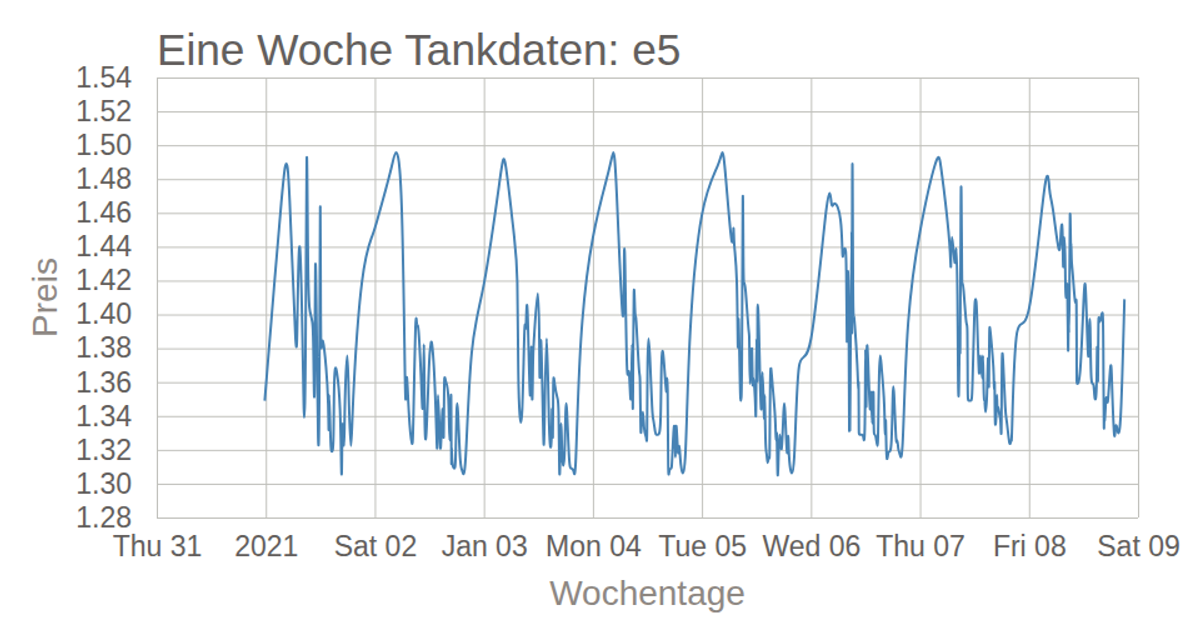
This line chart displays Ford stock prices over the course of one week. The visualization uses D3 version 5 to render an SVG, with time-scaled x-axis and linear y-axis. Data is loaded from a remote CSV file and smoothed using a basis curve. The chart includes labeled axes, a title, and a styled line path to represent the price fluctuations.
AI-generated descriptionMIT Licensed


Comments
Sign in to join the discussion.