🌍 Public
Scatter Plot
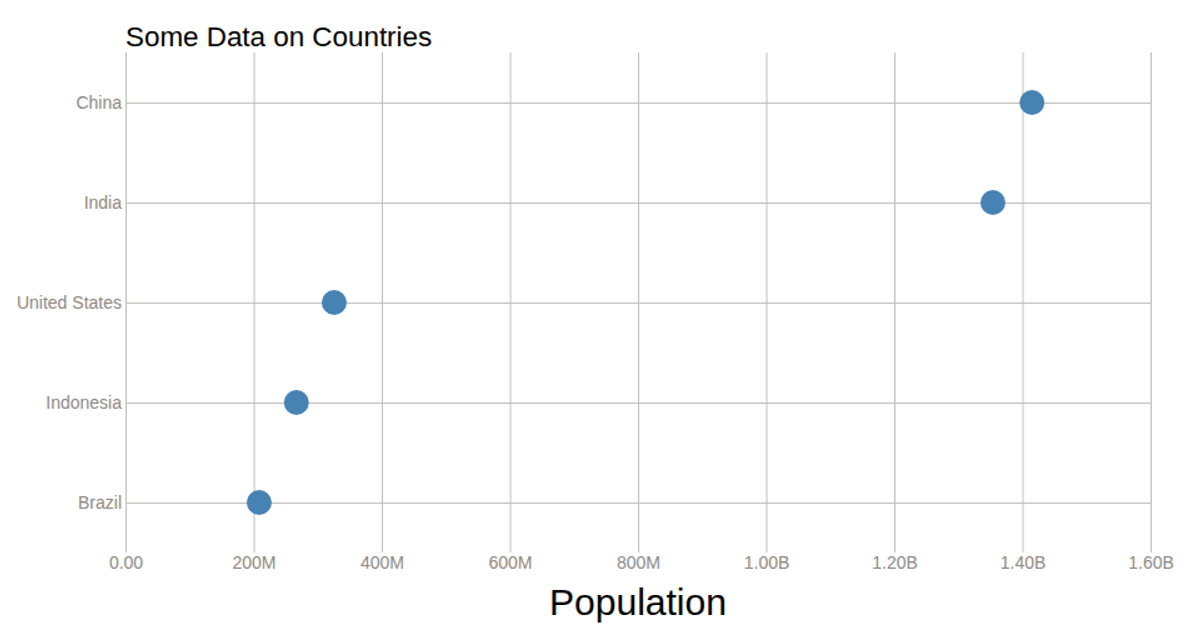
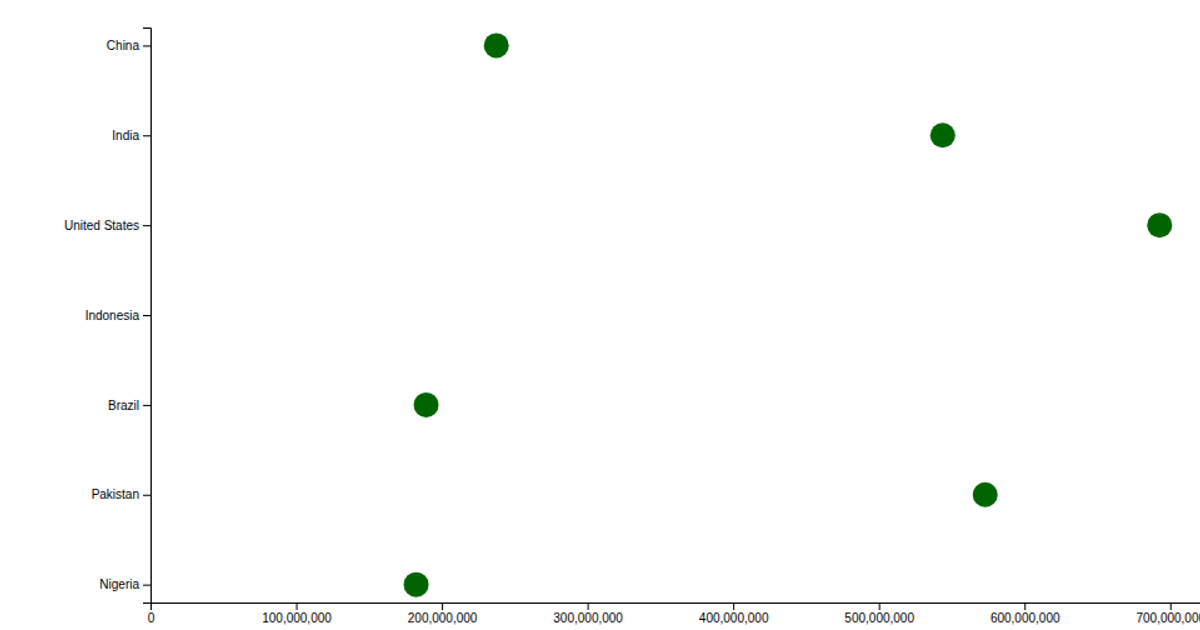
This scatter plot visualizes population estimates for seven countries, with each circle positioned along a linear scale for population and a point scale for country names. The visualization renders as an SVG using React and D3 v6, employing `scaleLinear`, `scalePoint`, `axisLeft`, and `axisBottom` to construct the axes and plot circles with dark green fill. The data is embedded as a static array and multiplied by 1,000 before being drawn.
AI-generated descriptionA bare minimum HTML page demonstrating use of CSS and JavaScript.
See also React Starter.
MIT Licensed






Comments
Sign in to join the discussion.