🌍 Public
Choropleth Map
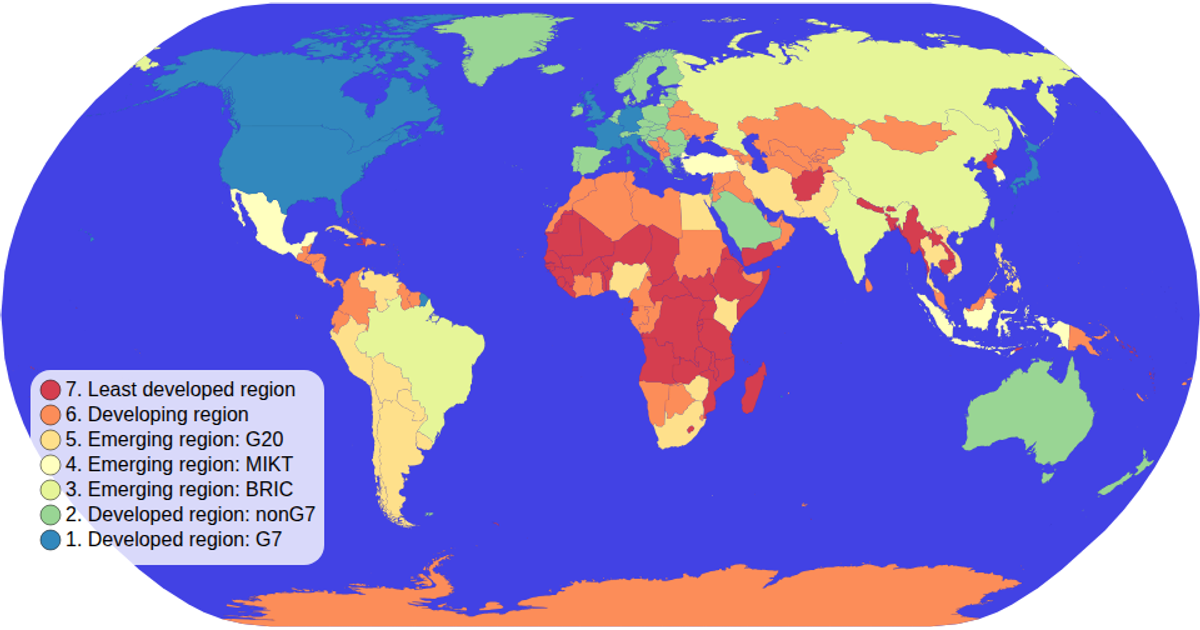
This choropleth map visualizes the income group of each country using a sequential color scale, with hover interactions highlighting individual nations. Built with D3.js (v5) and TopoJSON, it projects world geography via the Natural Earth projection and renders country boundaries as SVG paths. The color legend, generated with custom code, displays ordinal color swatches and labels. Data is sourced from the world-atlas package, merging TSV attributes with TopoJSON geometry.
AI-generated descriptionMIT Licensed




Comments
Sign in to join the discussion.