🌍 Public
hexbinchart
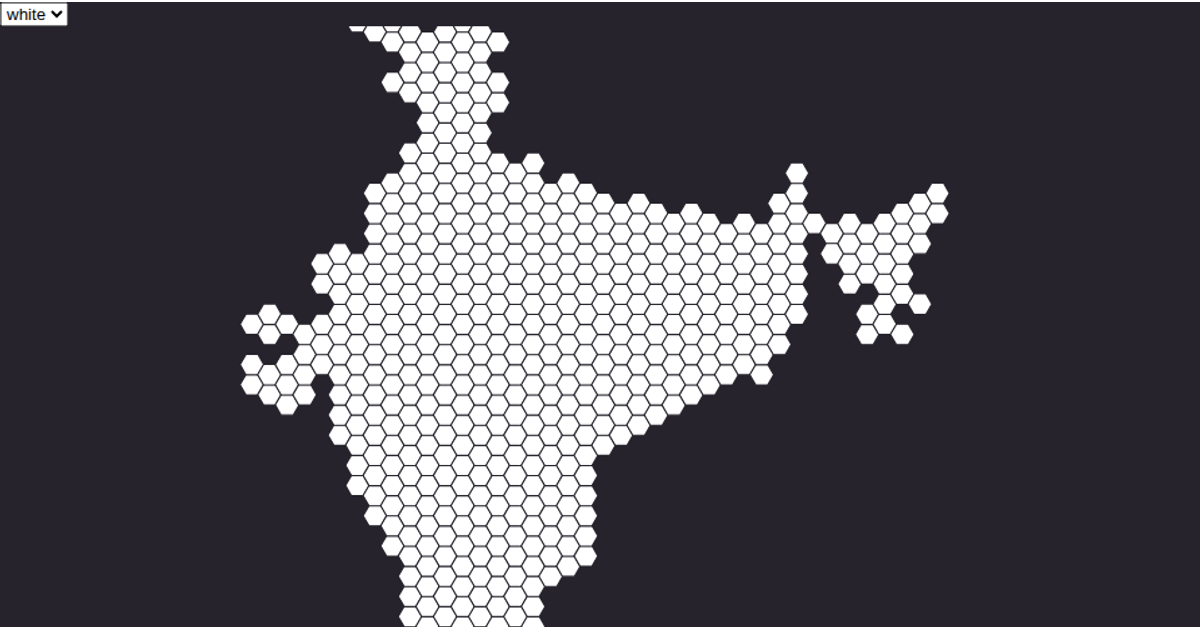
This example visualizes a label matrix from an orthographic image as a hexbin chart, using color to distinguish between eight different categorical labels. The code loads data from a CSV file, maps each cell’s label to a color using `d3.scaleOrdinal`, and partitions the points with the `d3.hexbin` API. The SVG output renders hexagonal bins clipped to the chart area, with each bin’s fill determined by the dominant label value, producing a gridded heatmap-like representation of the underlying image data.
AI-generated descriptionA demonstration of how to start using D3 version 6.
MIT Licensed




Comments
Sign in to join the discussion.