🌍 Public
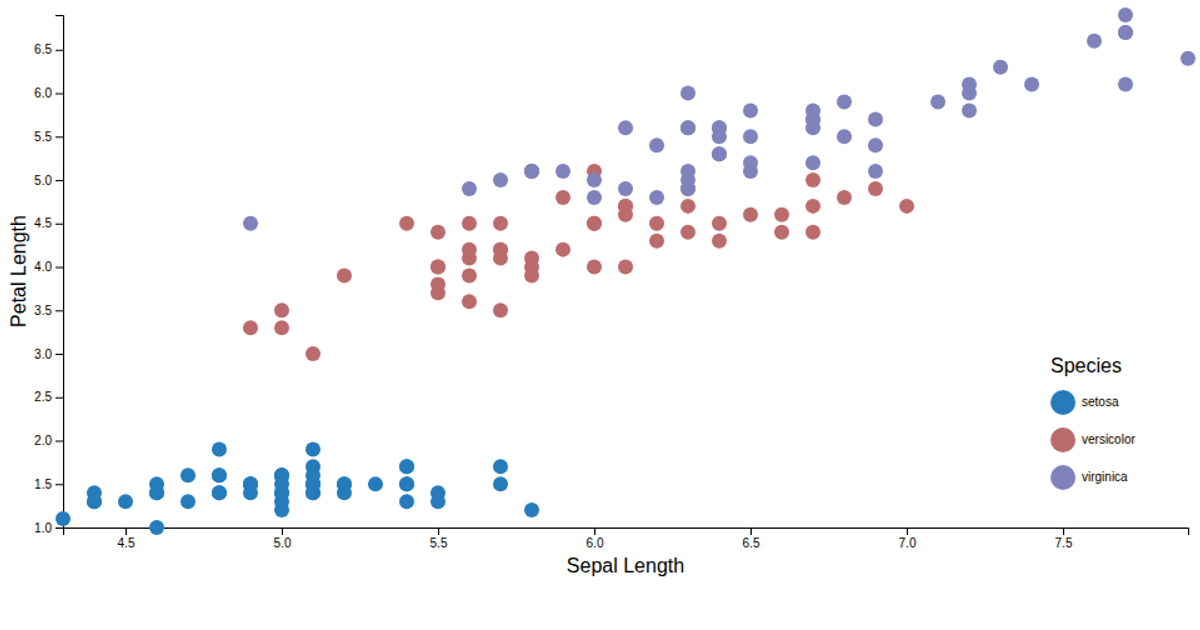
Iris Sepal vs Petal Length Scatter Plot
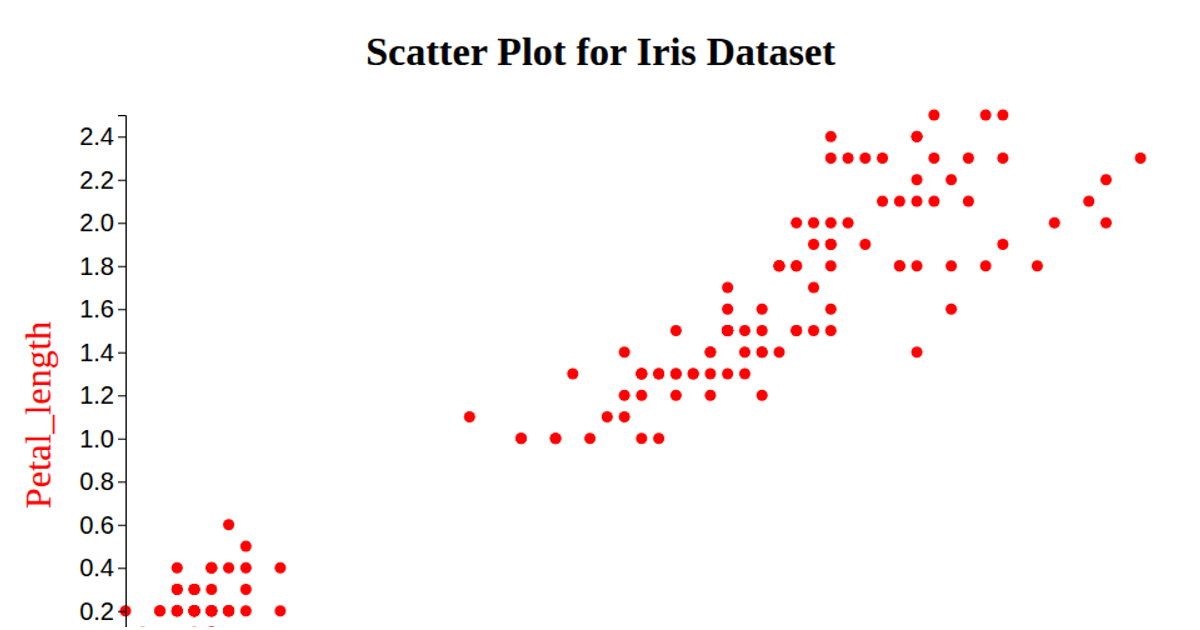
This scatter plot visualizes the classic Iris dataset, comparing sepal length against petal length for three iris species. Each species—setosa, versicolor, and virginica—appears as a distinct colored cluster, with red, blue, and green points respectively. The visualization uses Chart.js to render the plot on an HTML canvas, fetching the CSV data from a GitHub Gist. The chart displays clear separation between species, particularly highlighting how petal length distinguishes the groups, while providing labeled axes for both measurements.
AI-generated descriptionMIT Licensed




Comments
Sign in to join the discussion.