🌍 Public
County Facts
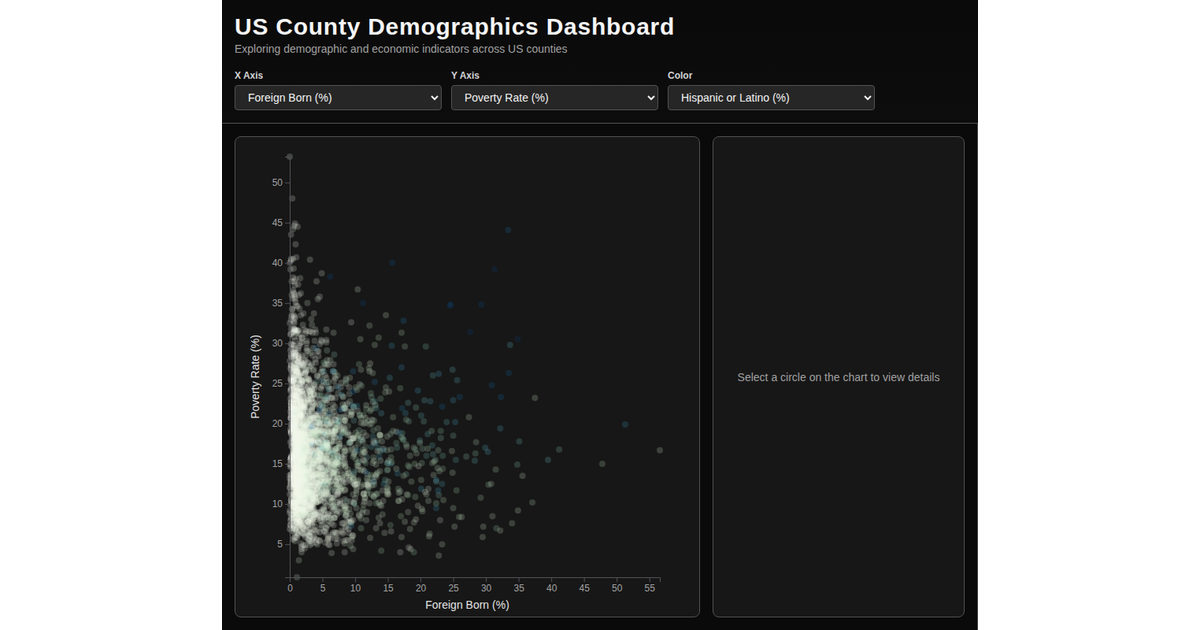
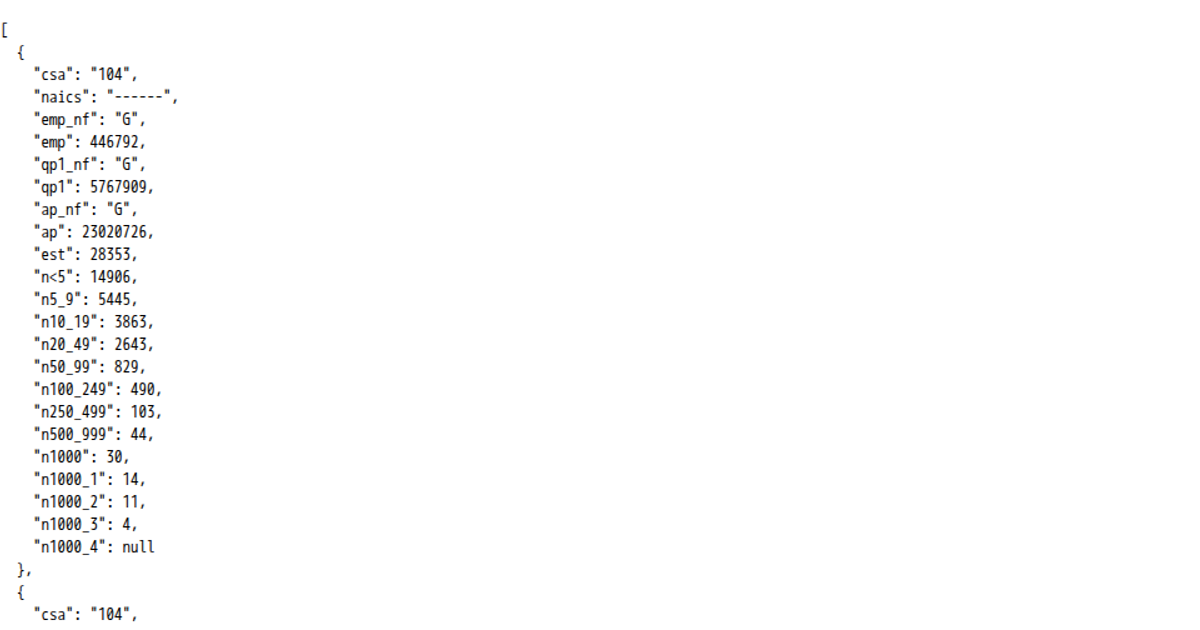
This example displays a CSV dataset of county-level statistics from the US Census Bureau, parsed and rendered as a formatted JSON object in the browser. It uses the imported `d3` library to load and manipulate the data, with the first row of the file exposed for inspection. The visualization is minimal, focusing on the raw data structure rather than a graphical chart, and demonstrates how to integrate external CSV data into a VizHub project.
AI-generated descriptionThe Penguins Dataset, loaded and parsed as CSV.
Fork and modify this template to import your data to VizHub and export it for use in other vizzes! To do that:
- Fork this viz
- Clear out the README
- Update the README with details about your dataset (including original source)
- Replace
data.csvwith your own data - Replace the parsing logic in
index.jswith your own - Set the custom URL so you can import from it easily
Challenge
- Find 3 datasets on a topic you are interested in
- For each of those, fork this viz and replace the data
- Parse the quantitative attributes into numbers
- Update
README.mdto indicate the original data source
MIT Licensed



Comments
Sign in to join the discussion.