🌍 Public
Grouped Bar Chart with React & D3
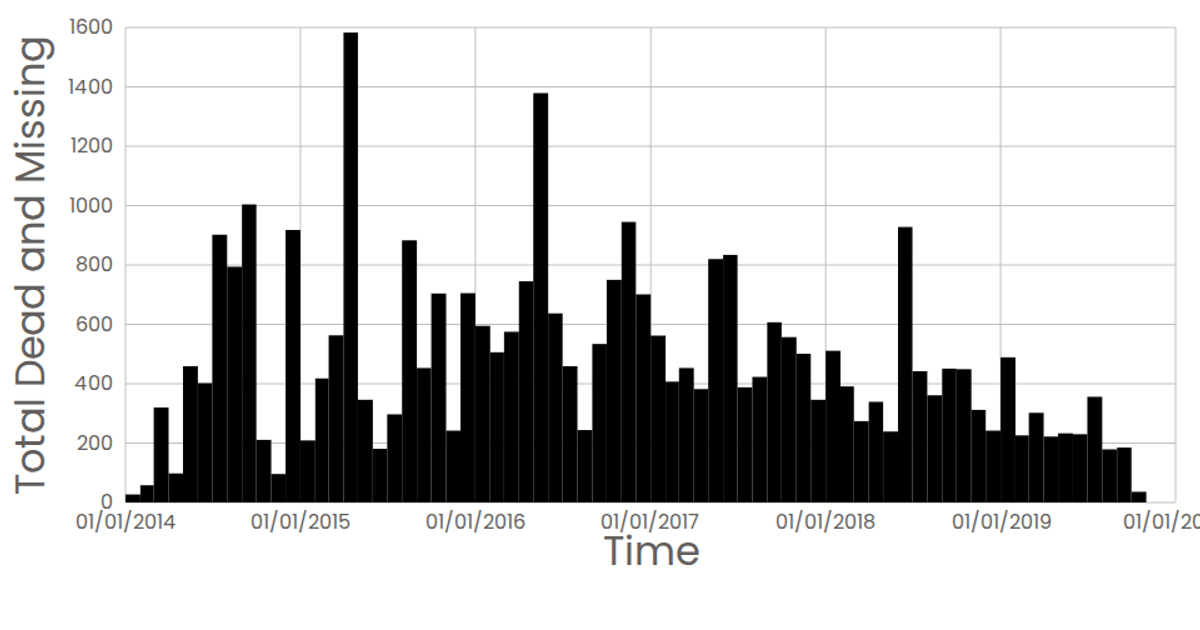
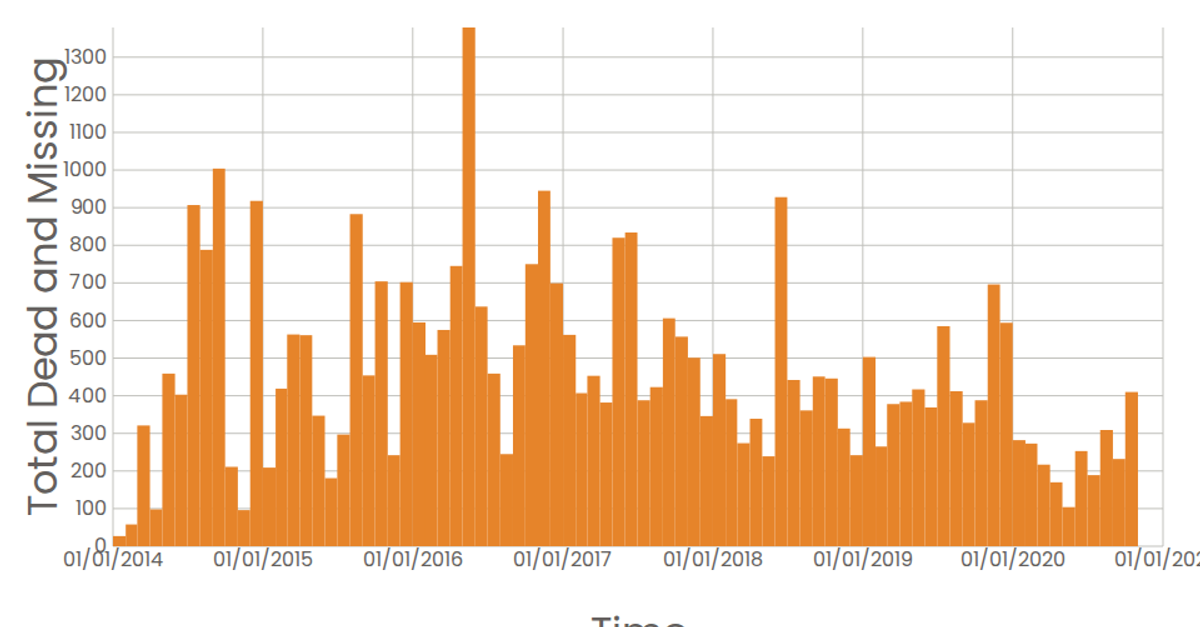
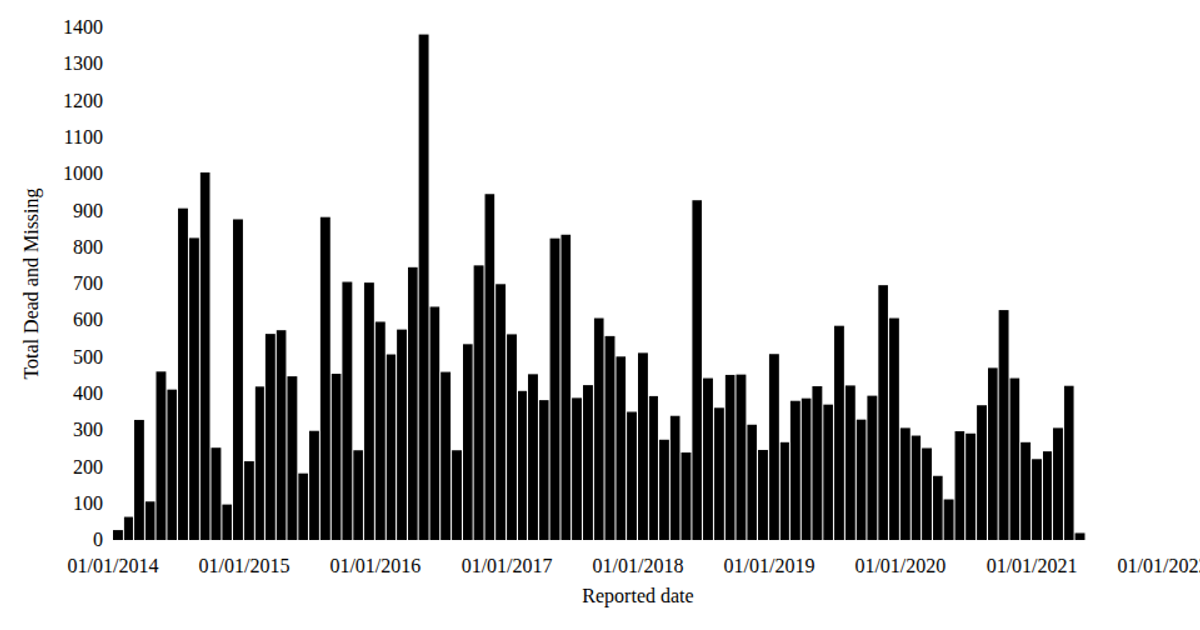
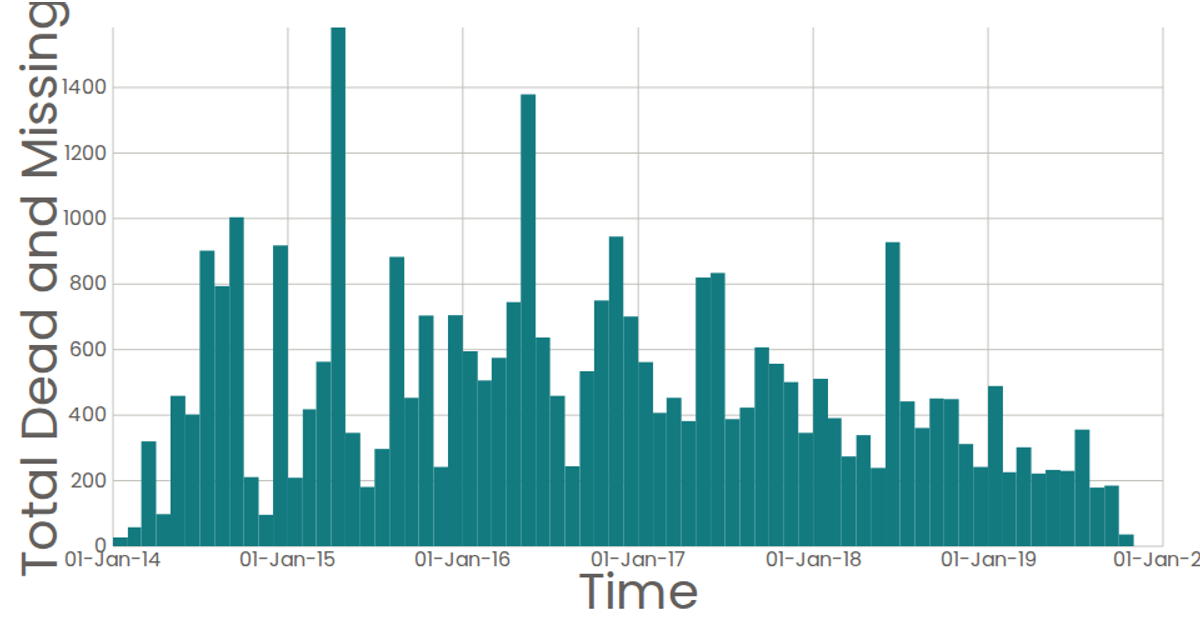
This grouped bar chart visualizes the total number of dead and missing migrants over time, with each bar representing a monthly sum. The chart uses React for component-based rendering and D3 v7 for data loading, binning, and scales. Data is fetched via d3.csv and binned using d3.bin with time thresholds, then displayed as SVG rectangles. The x-axis uses d3.scaleLinear with d3.timeFormat labels, while the y-axis is also linear. Hovering a bar reveals its exact value via an SVG title tooltip.
AI-generated descriptionLoading Data with React & D3
MIT Licensed




Comments
Sign in to join the discussion.