🔗 Unlisted
Sankey Umsatzverteilung
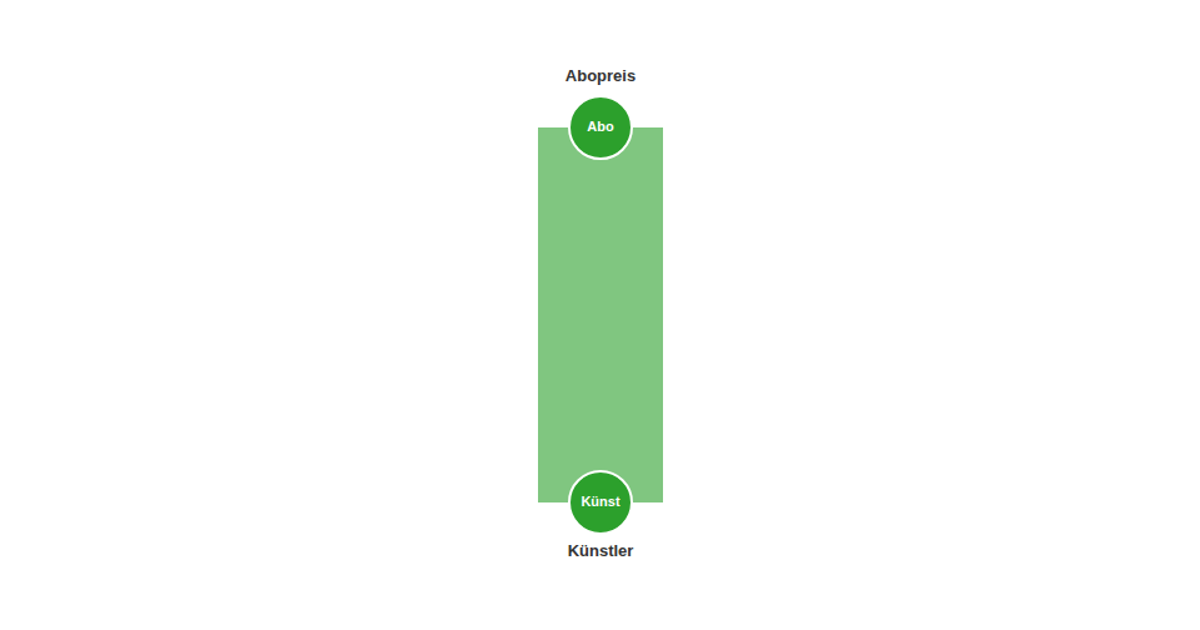
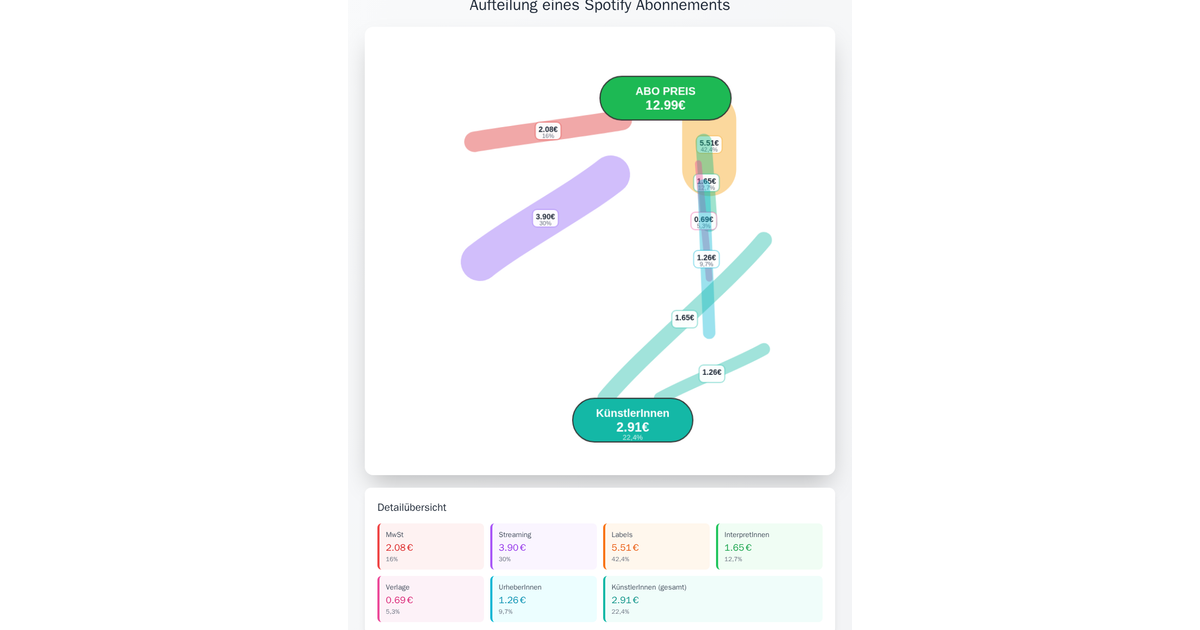
A scrollytelling visualization breaks down a €10.99 Spotify Premium subscription, showing how the money flows through operational costs, record labels, and publishers to artists. Built with React and D3 v7, it uses a custom vertical Sankey diagram with animated transitions that reveal additional nodes and links as sections come into view via an IntersectionObserver. The `d3-sankey` layout computes node positions and link paths, while D3 transitions animate changes between sections.
AI-generated descriptionMIT Licensed



Comments
Sign in to join the discussion.