🌍 Public
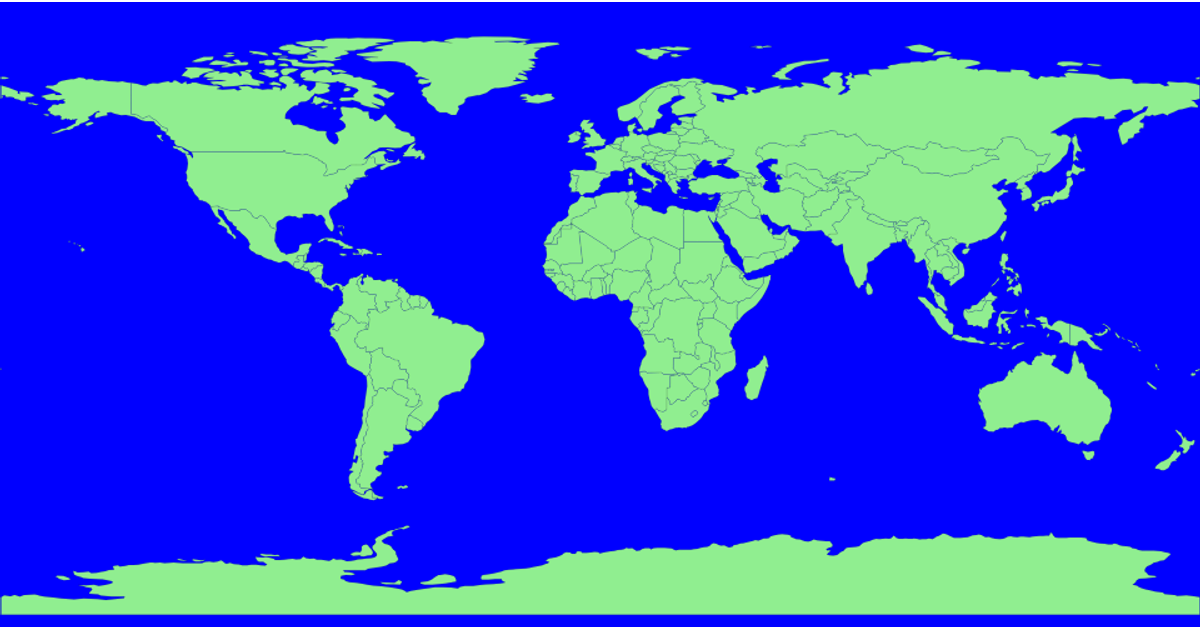
World Map with D3.js!
This example displays a world map rendered as an SVG using D3 version 5 and TopoJSON, with the geographic projection and path generation handled by d3.geoPath. The page loads world topology data and draws country boundaries onto a 960-by-500-pixel canvas. It serves as a basic demonstration of integrating D3’s mapping utilities with external TopoJSON data to produce an interactive-ready visualization.
AI-generated descriptionA demonstration of how to start using D3 version 6.
MIT Licensed


Comments
Sign in to join the discussion.