🌍 Public
ICE 6 multi line
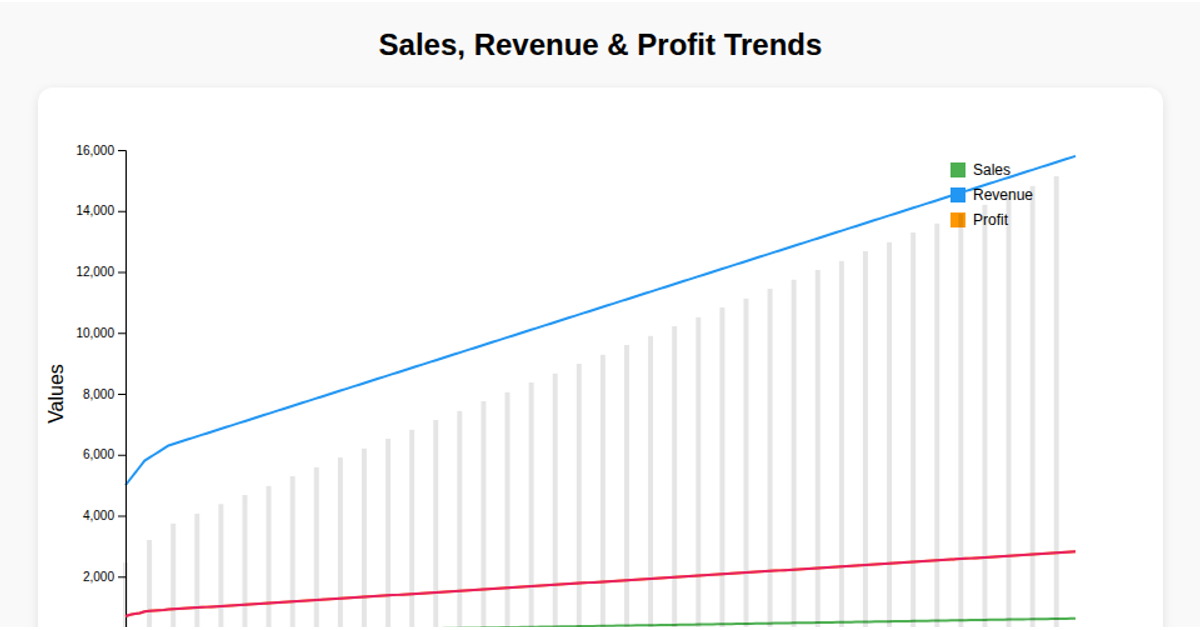
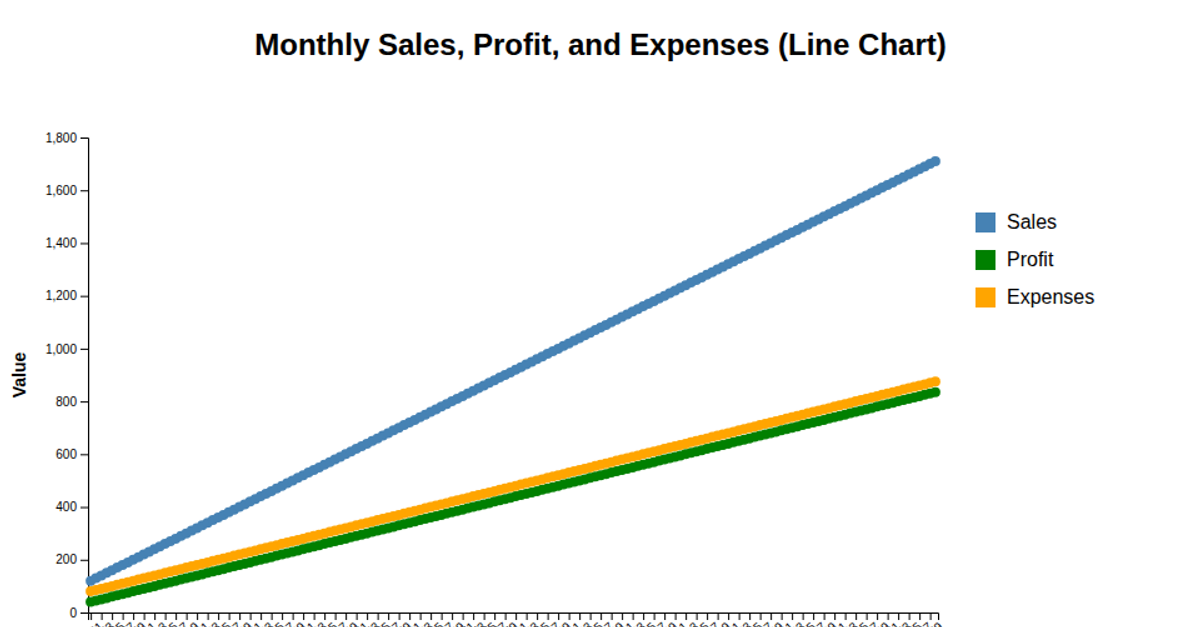
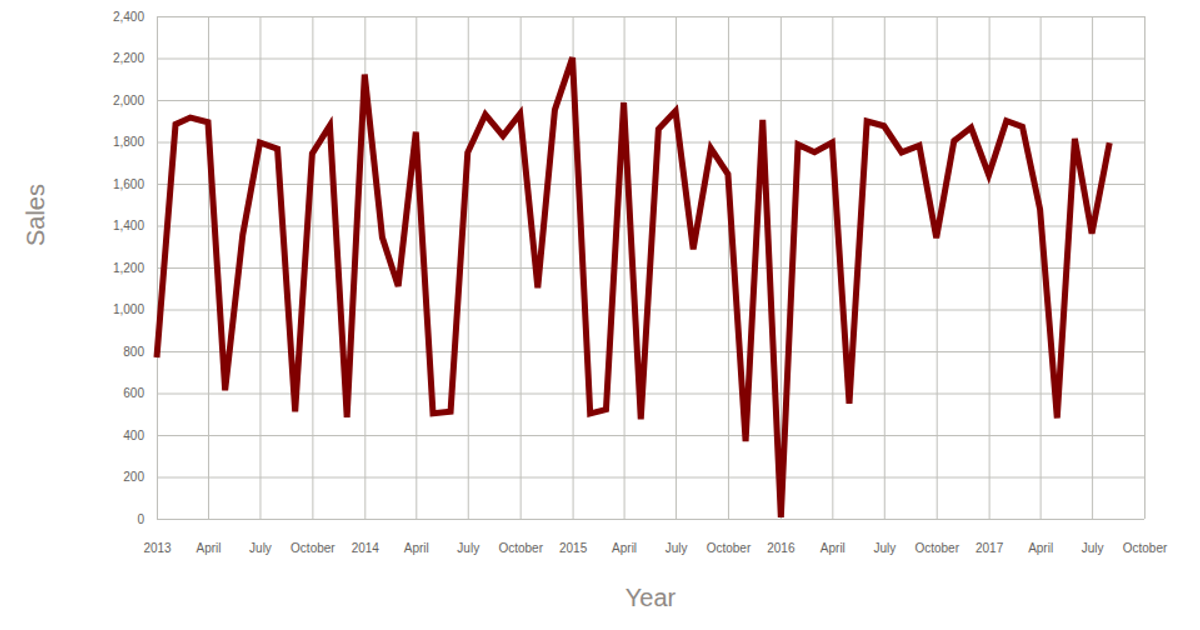
This example displays a multi-series line chart titled "Sales Multi-Series Line Chart," plotting Sales, Profit, and Expenses across 161 time points. The chart filters the CSV data to every tenth month, reducing visual clutter. Built with D3.js v7, the visualization uses `d3.line` to create three distinct colored paths and renders the output as SVG. The code also includes axes, a legend, and data point markers, with the y-axis scaled to accommodate the maximum value across all three series.
AI-generated descriptionMIT Licensed





Comments
Sign in to join the discussion.