🌍 Public
Fork of TARIKU ENDALE COLOR EDITING ON D3 VISUALIZATION
TTARIKUENDALE
Last edited Sep 6, 2022
Created on Sep 6, 2022
Forked from TARIKU ENDALE COLOR EDITING ON D3 VISUALIZATION
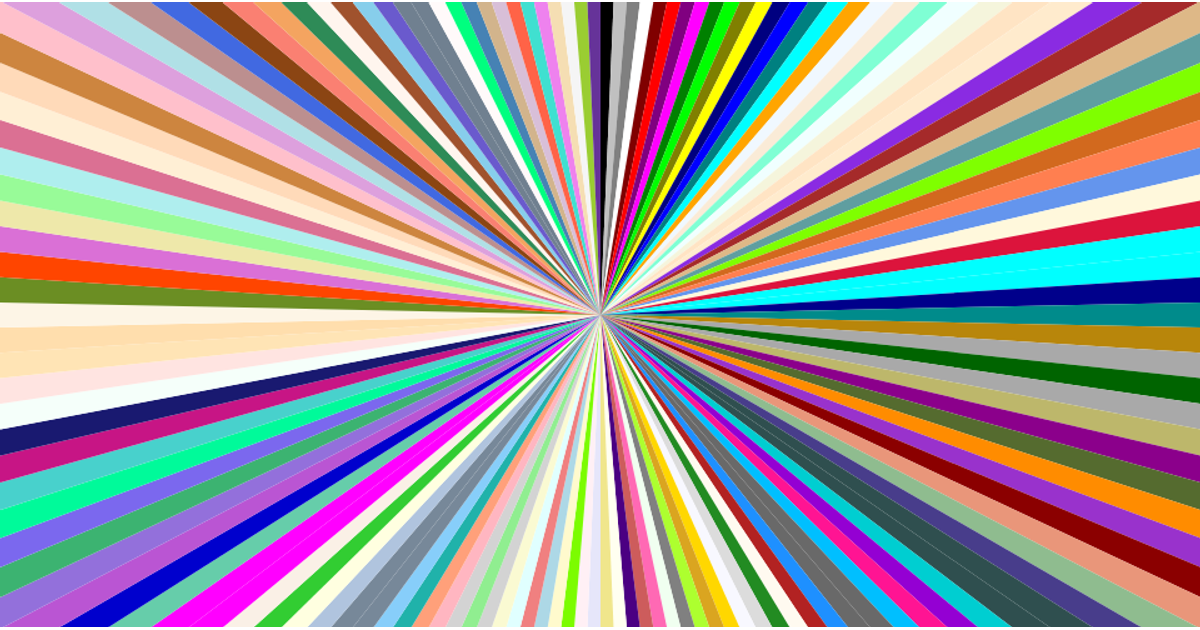
This example visualizes CSS named colors as a radial burst, with each color represented as a slice of a pie chart emanating from the center. The code loads color data from a CSV file using `d3.csv` and renders the visualization as SVG with React components. It uses `d3.pie` to compute arc angles and `d3.arc` to generate the path shapes, while React handles state management and rendering through the `useState` and `useEffect` hooks.
AI-generated descriptionA program that loads in some data about CSS named colors using D3 utilities, and uses React to render the data as a radial burst!
MIT Licensed


Comments
Sign in to join the discussion.