🌍 Public
ACT6_TASK2
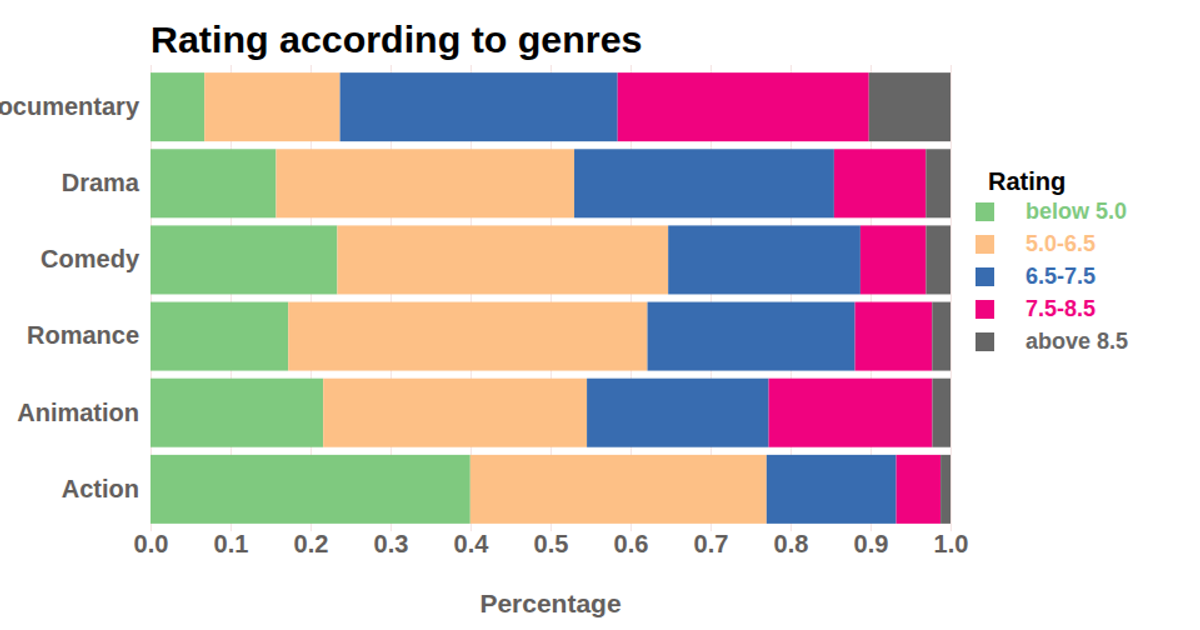
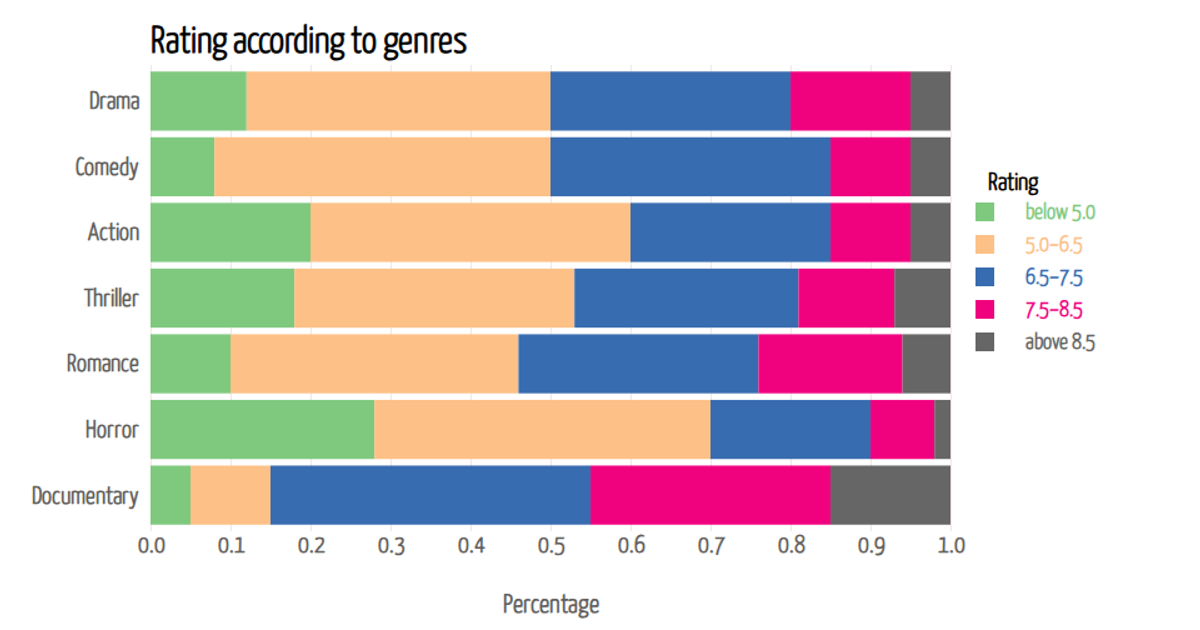
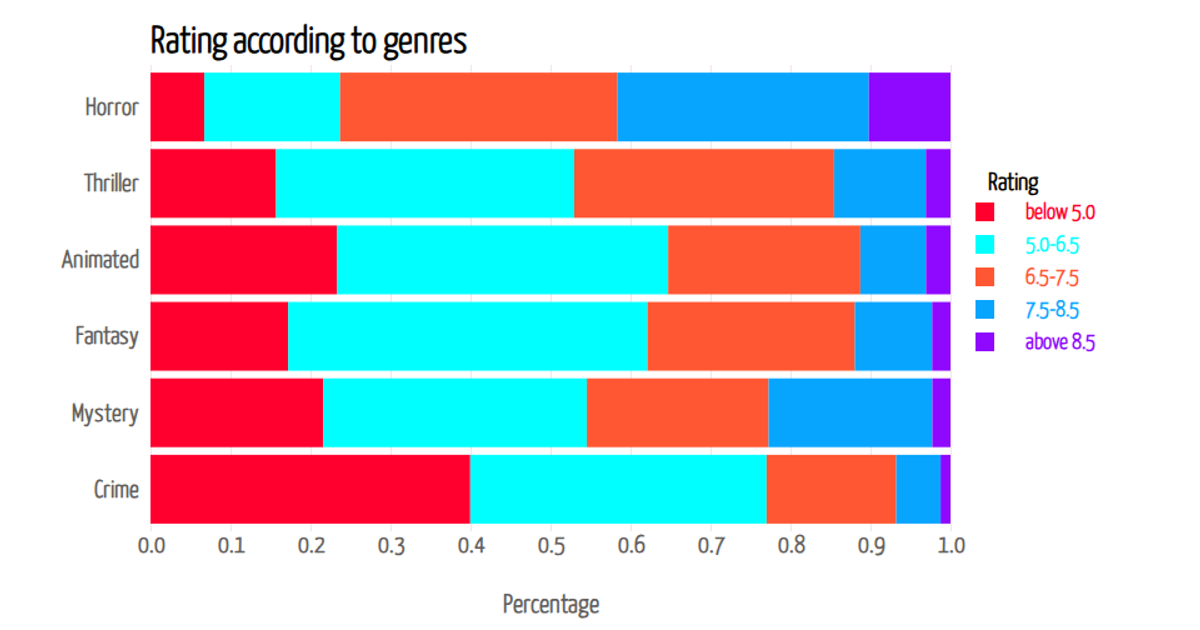
The visualization displays the distribution of IMDb movie ratings across six genres, using horizontally stacked bars to show the proportional share of five rating brackets from "below 5.0" to "above 8.5." Each genre row is segmented with colors mapped via `d3.scaleOrdinal`, and the segment lengths encode the percentage via a `d3.scaleLinear` x-axis. Tooltips, triggered by mouse events, reveal the exact percentage for a hovered segment using d3's selection and formatting APIs. The chart reads from `data.csv` and renders shapes as SVG elements within an HTML page.
AI-generated descriptionMIT Licensed



Comments
Sign in to join the discussion.