🌍 Public
Fork of Vega-Lite API Template
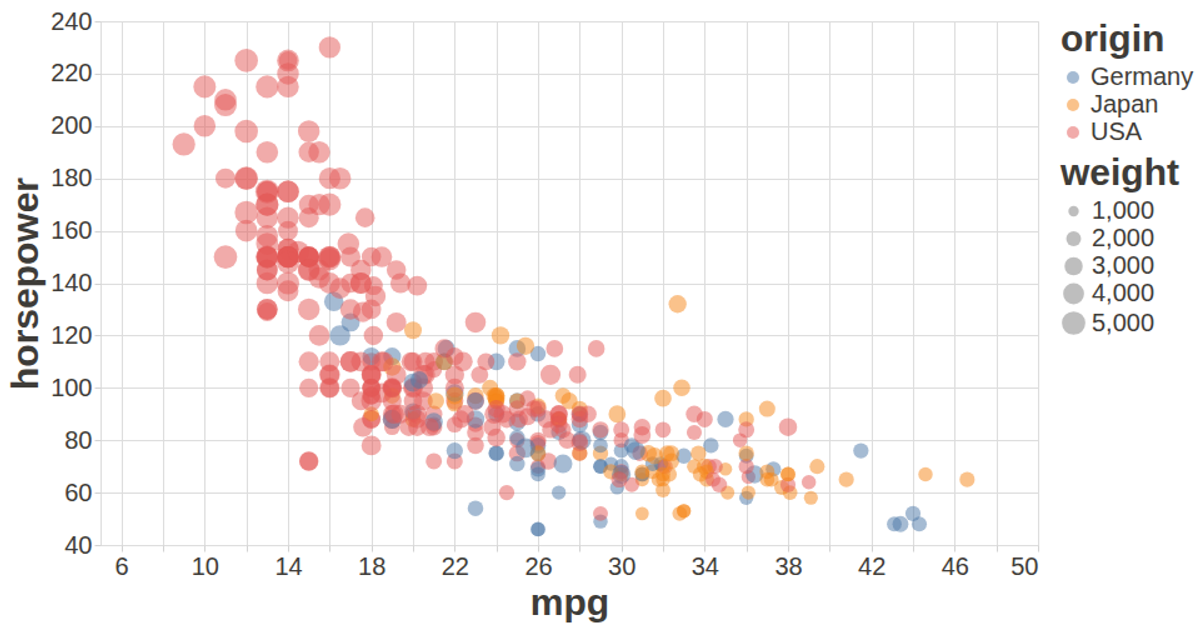
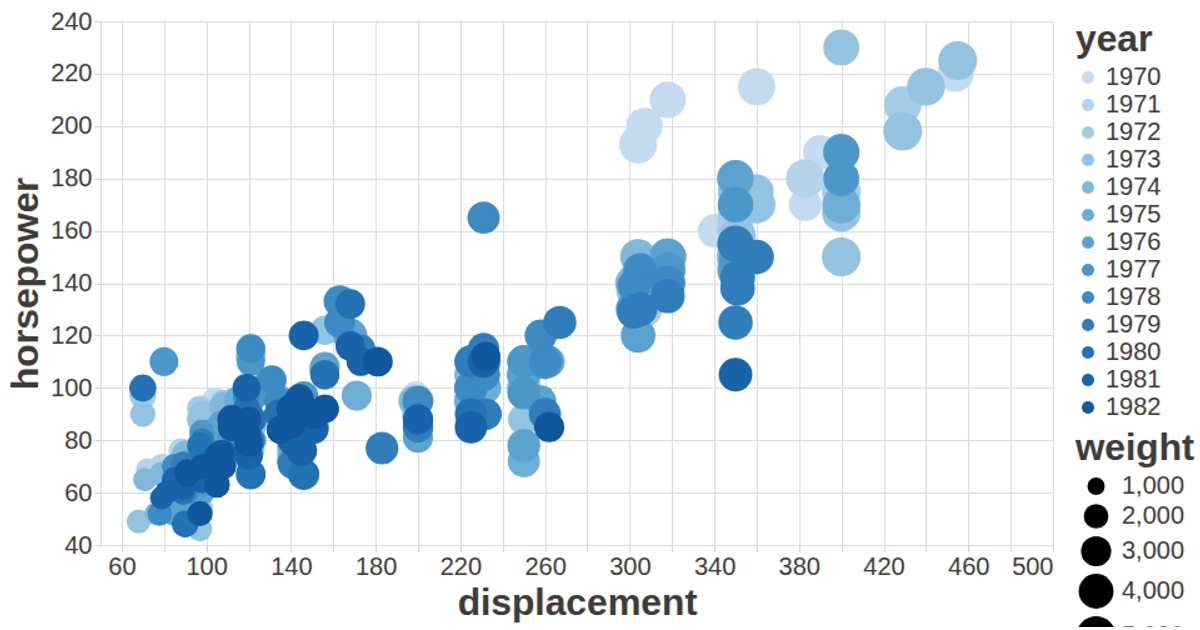
This visualization displays automobile data as a scatter plot of Household Income against Province, with tooltips revealing the associated House attribute. Built with the Vega-Lite API, it loads CSV data from the UCI Machine Learning Repository's Auto MPG dataset and renders as a full-window SVG. The code registers Vega, Vega-Lite, and the vega-lite-api with vega-tooltip, customized through a configuration that adjusts font sizes and colors.
AI-generated descriptionA visualization constructed using the vega-lite-api.
The data shown here comes from the UCI Machine Learning Repository: Auto MPG Data Set, via Gist: Scatter Plot with Menus.
MIT Licensed



Comments
Sign in to join the discussion.