🌍 Public
Fork of World Happiness and Health Expenditures Correlation
SShan Gao
Last edited May 5, 2021
Created on May 5, 2021
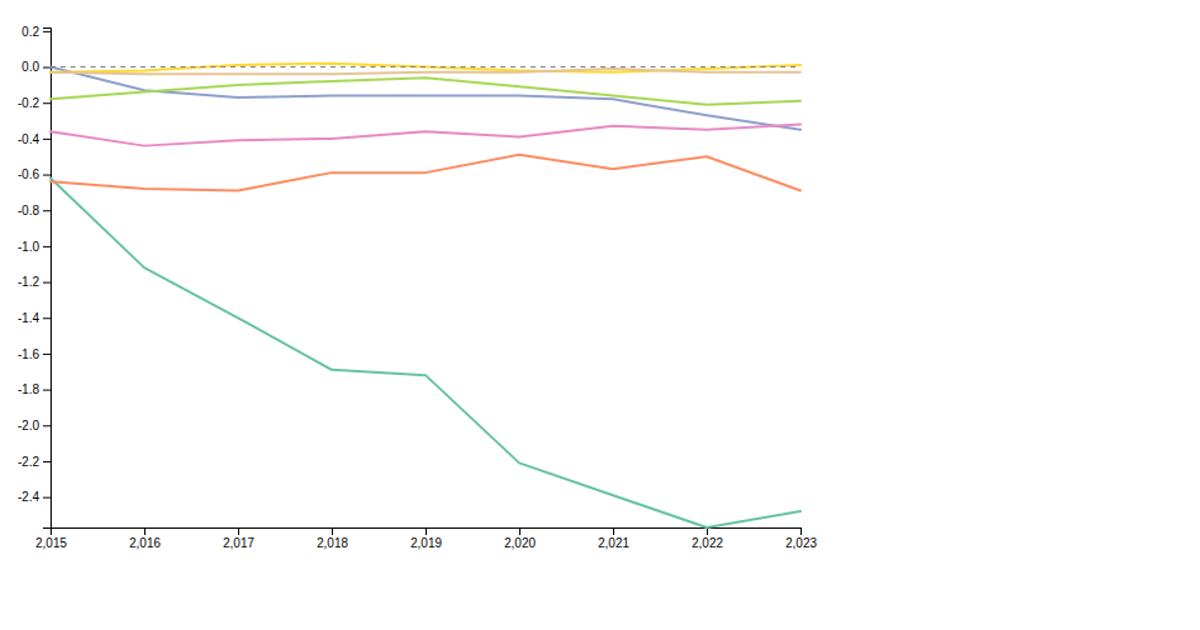
This visualization shows the correlation between national happiness scores and health expenditures per person, using a line chart to depict the trend across countries. It loads country-level data from a CSV file and renders it with Vega-Lite, using vega-lite-api and d3.csv for data fetching. The chart is customized with config.js for readability, and includes a layer for a least-squares regression line exported from lregression.js, which calculates the linear relationship fit to the data points.
AI-generated descriptionMIT Licensed



Comments
Sign in to join the discussion.