🌍 Public
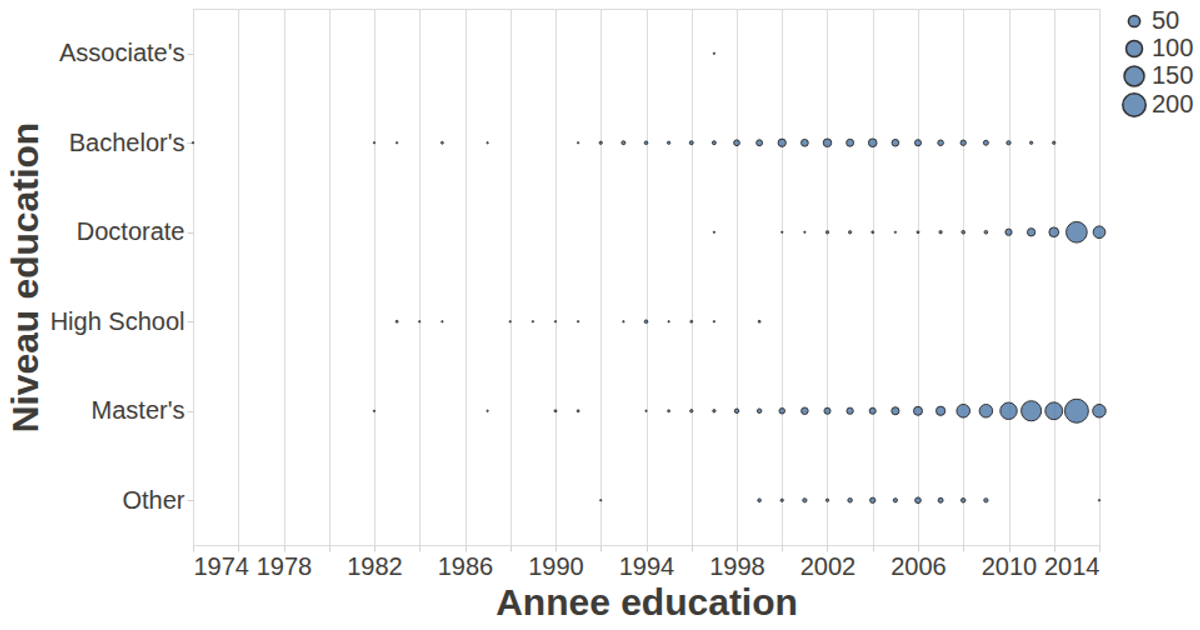
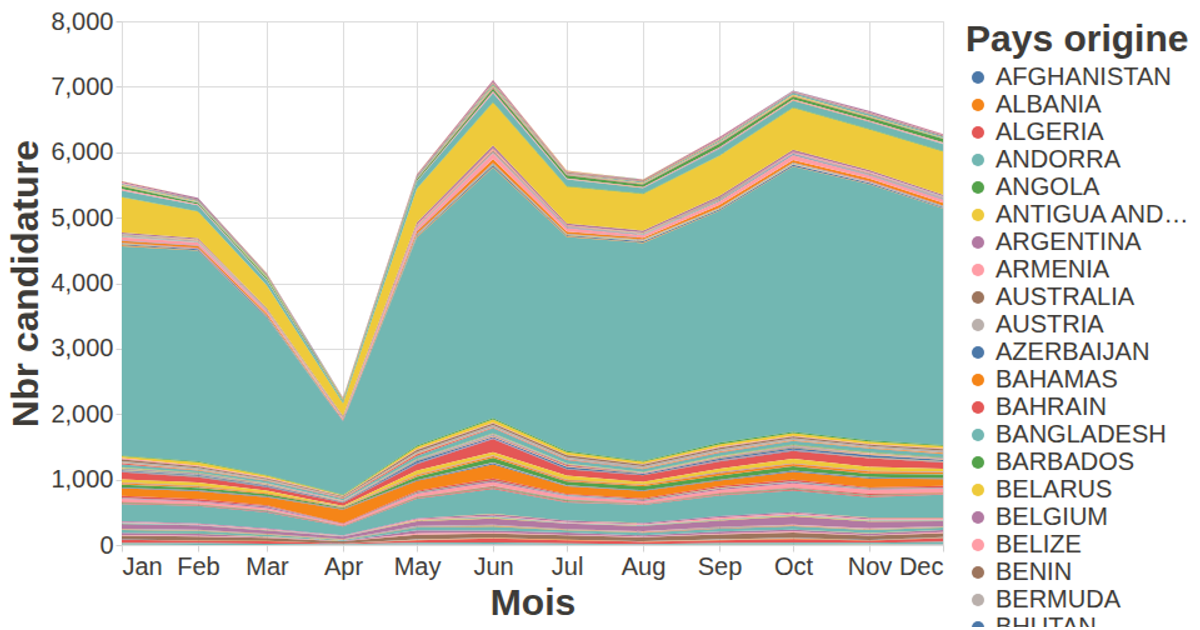
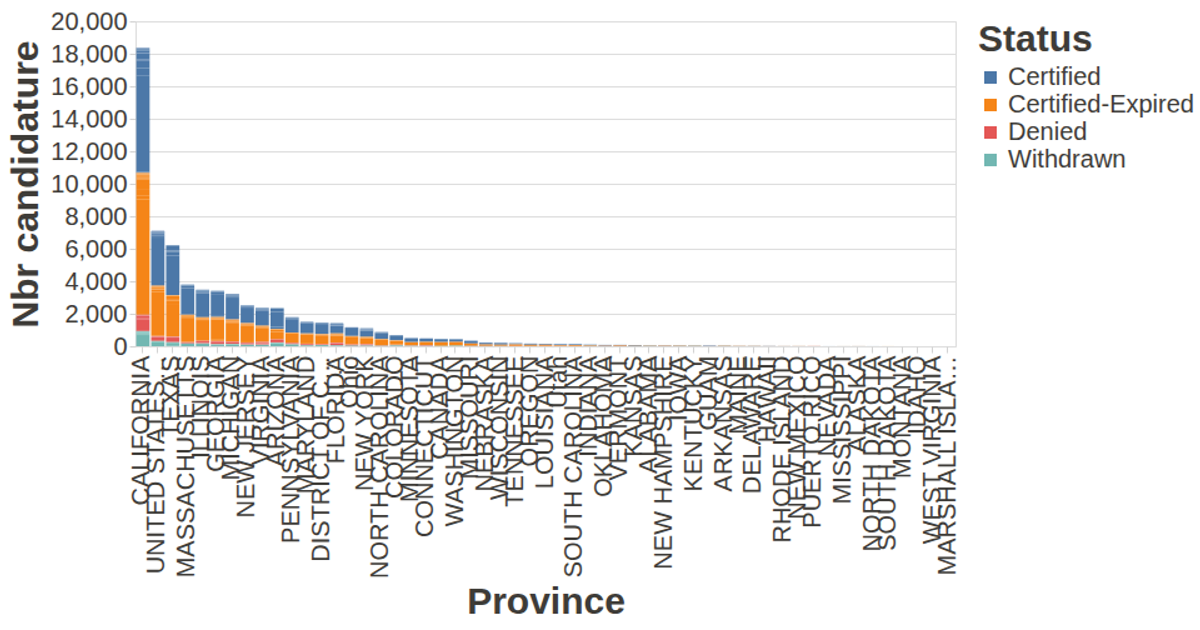
Nbr dossier candidature / plateforme et niveau
This example visualizes the number of job applications per education level and platform using a line chart. The y-axis counts applications, the x-axis represents education level, and color distinguishes platforms. Data is loaded via `d3.json` from a GitHub gist, and the chart is rendered with the vega-lite-api library, configured with custom axis styling and tooltips through the vega-tooltip handler.
AI-generated descriptionA visualization constructed using the vega-lite-api.
MIT Licensed




Comments
Sign in to join the discussion.