🌍 Public
VarshaGNetwork
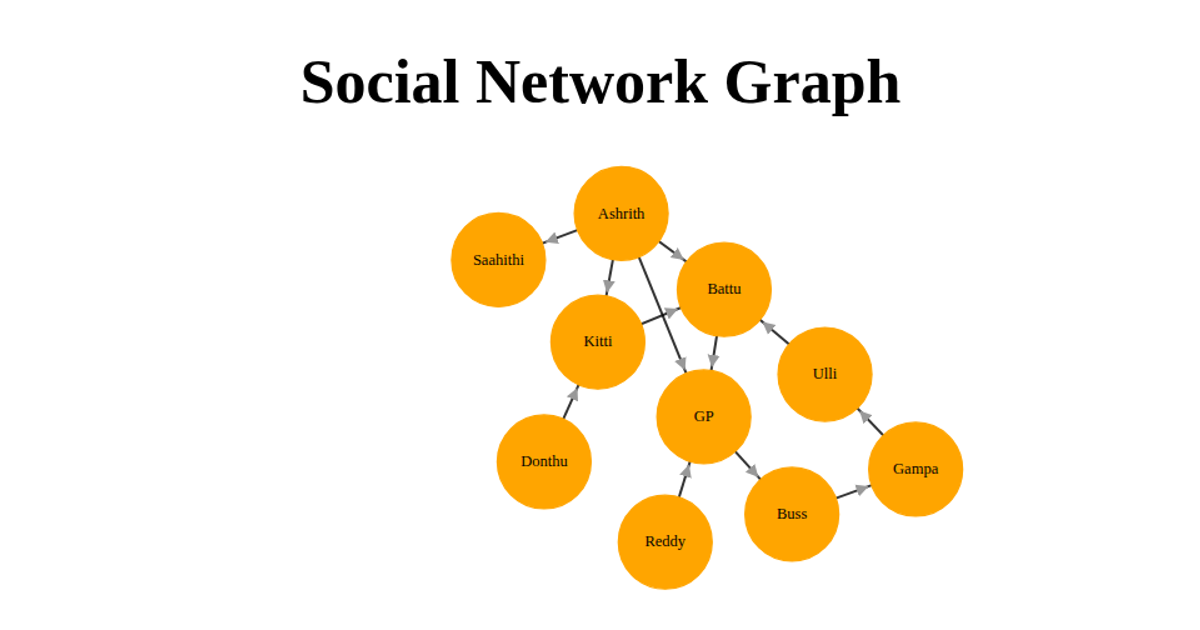
This interactive social network diagram shows ten people connected by directed “Friend with” relationships, rendered as an SVG force-directed graph. The visualization uses `d3.forceSimulation` with forceLink, forceManyBody, forceCollide, and forceCenter to position nodes, while drag behavior allows users to rearrange them. All nodes are colored orange, and hover interactions highlight a node with a thick green outline. Data is loaded from a local JSON file, and the arrow markers on links indicate the direction of each friendship edge.
AI-generated descriptionMIT Licensed




Comments
Sign in to join the discussion.