🌍 Public
Stacked Bar Chart
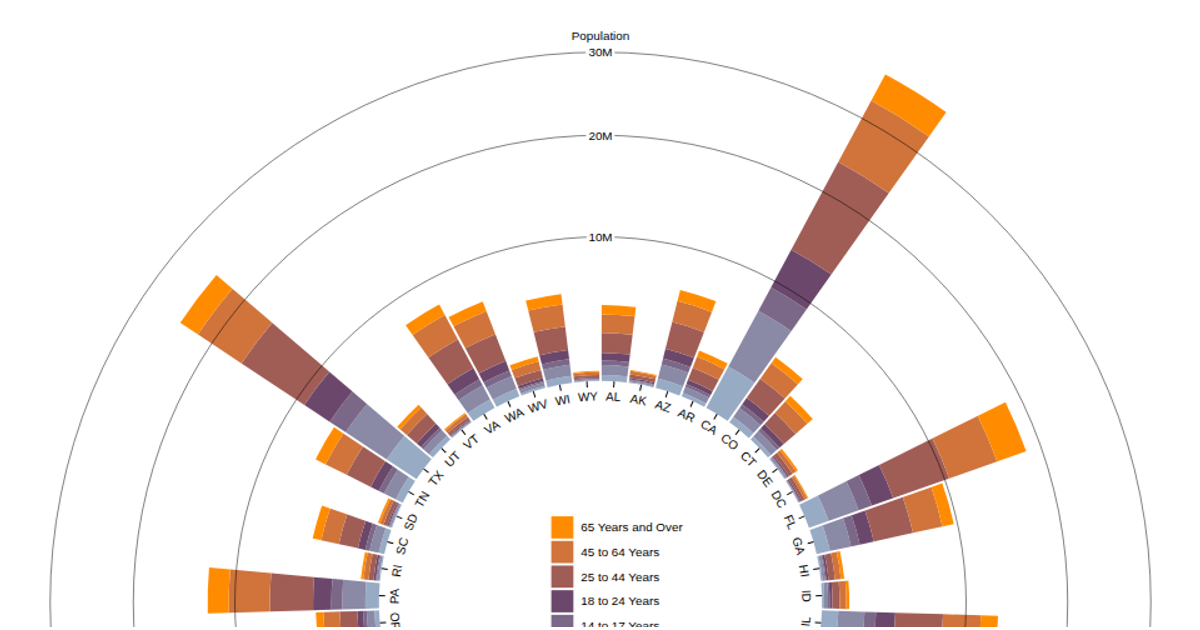
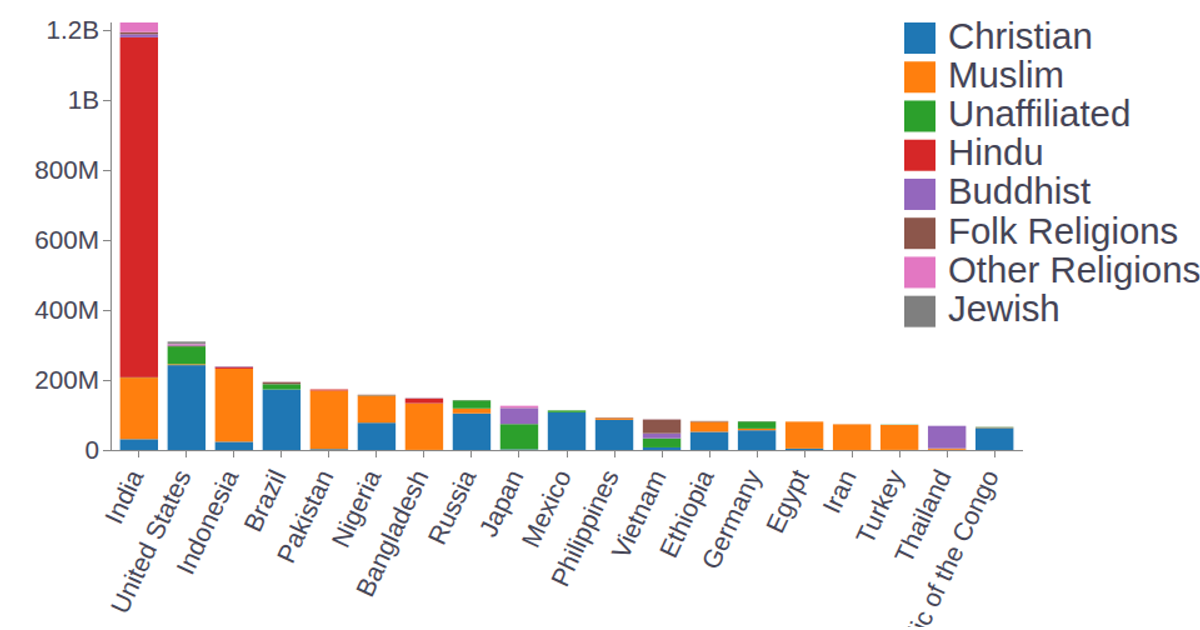
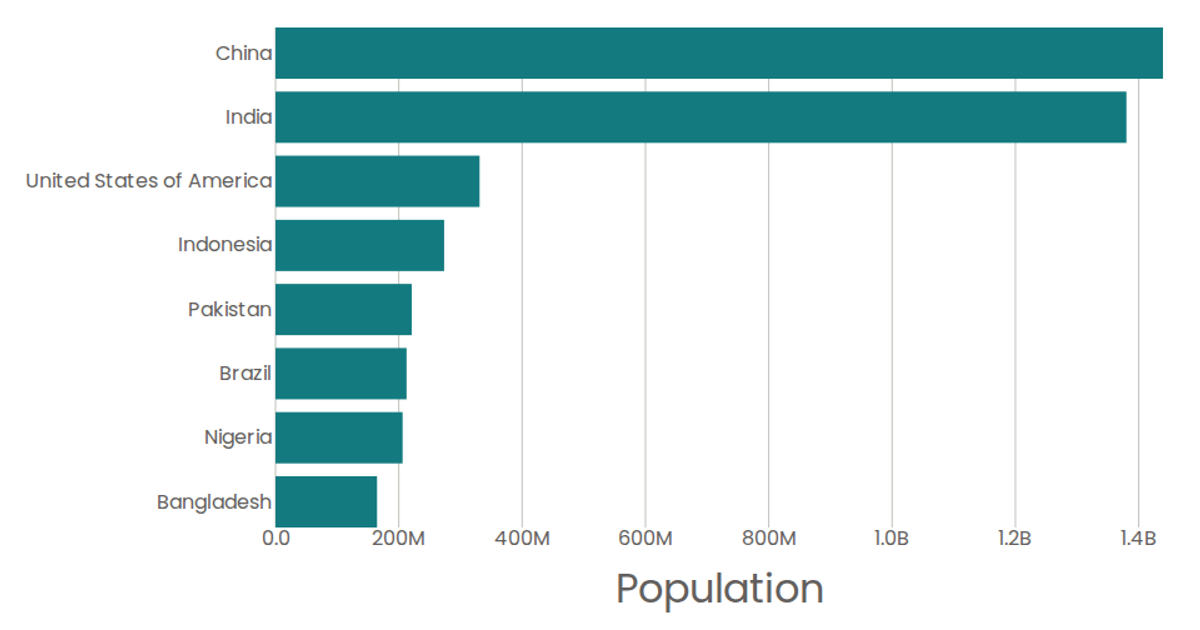
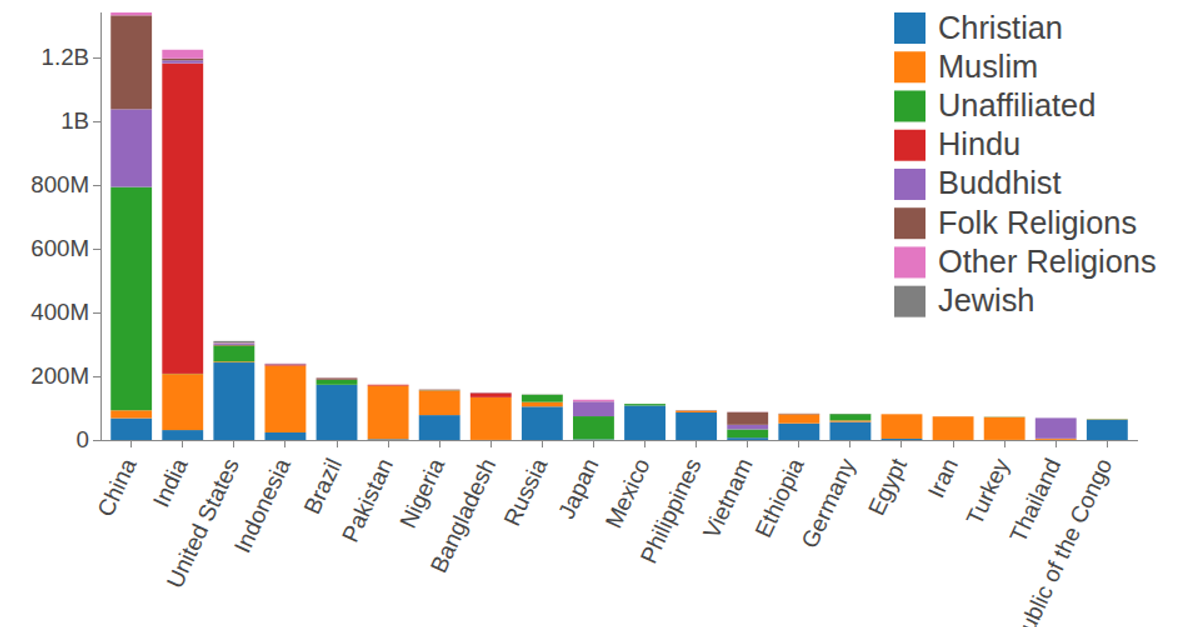
This stacked bar chart displays population data for cities, grouped by state and country. It uses D3.js v6 to process the nested dataset with `d3.nest()` and `d3.stack()`, then renders the stacks as SVG rectangles with an ordinal color scale. The chart includes axes via `d3.axisBottom()` and a legend. The data is hardcoded in the script rather than loaded from an external source.
AI-generated descriptionAn example showing the capabilities of VizHub:
- Loads D3 via UNPKG.
- Demonstrates use of
importfrom"d3". - Demonstrates use of
importfrom local ES6 modules.
MIT Licensed



Comments
Sign in to join the discussion.