🌍 Public
Activity6_Task2_Q3
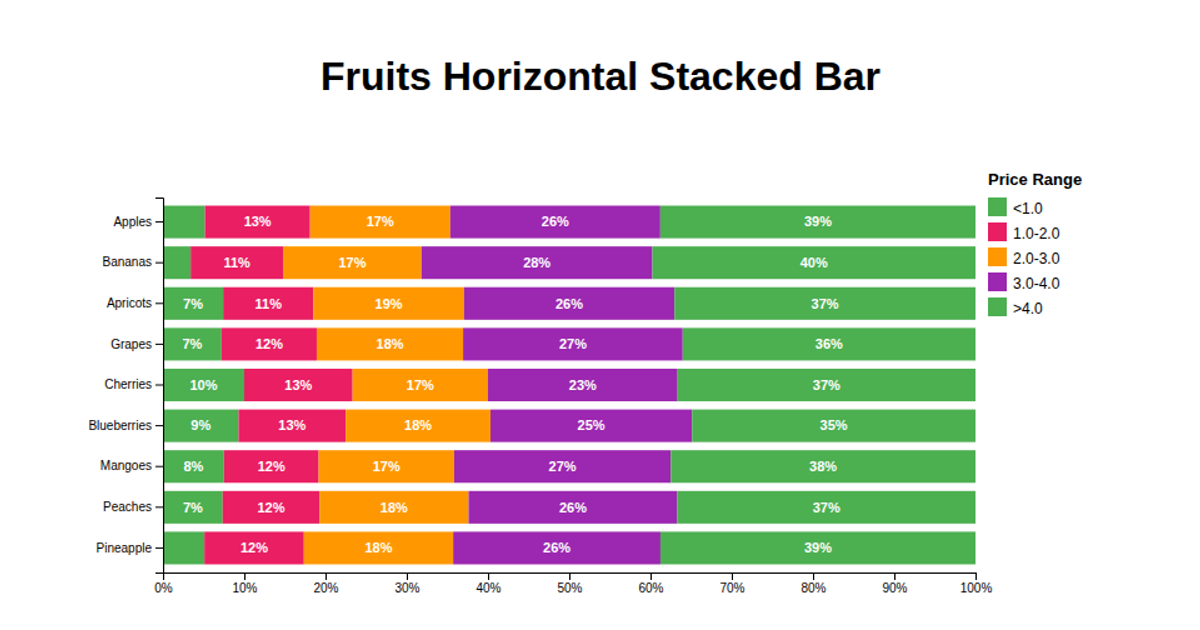
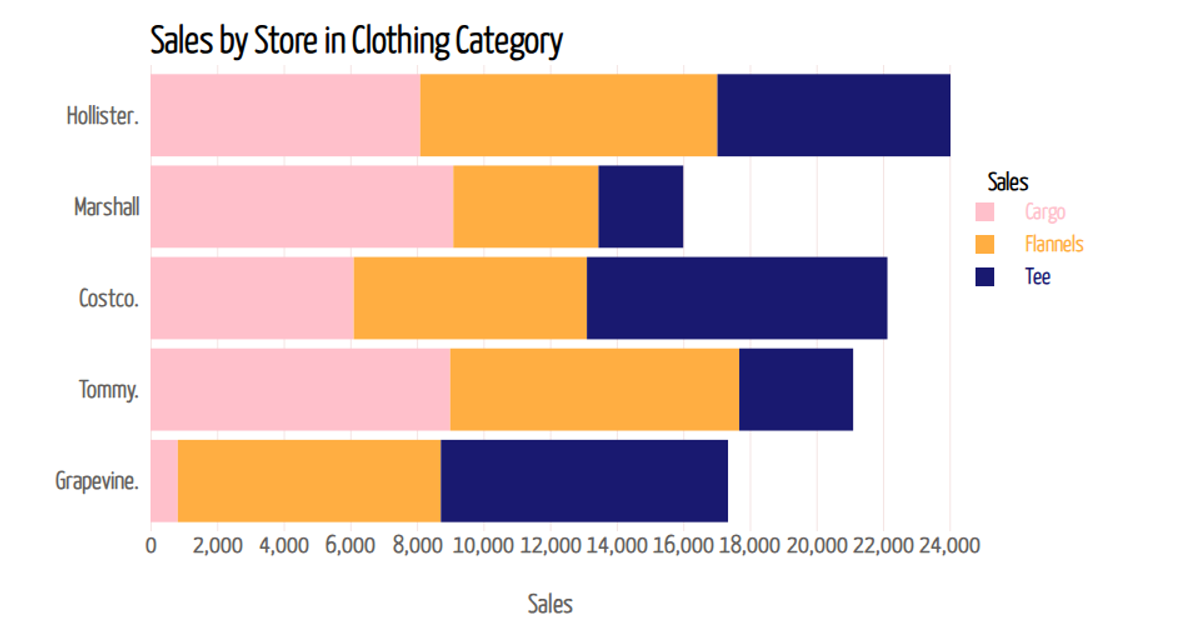
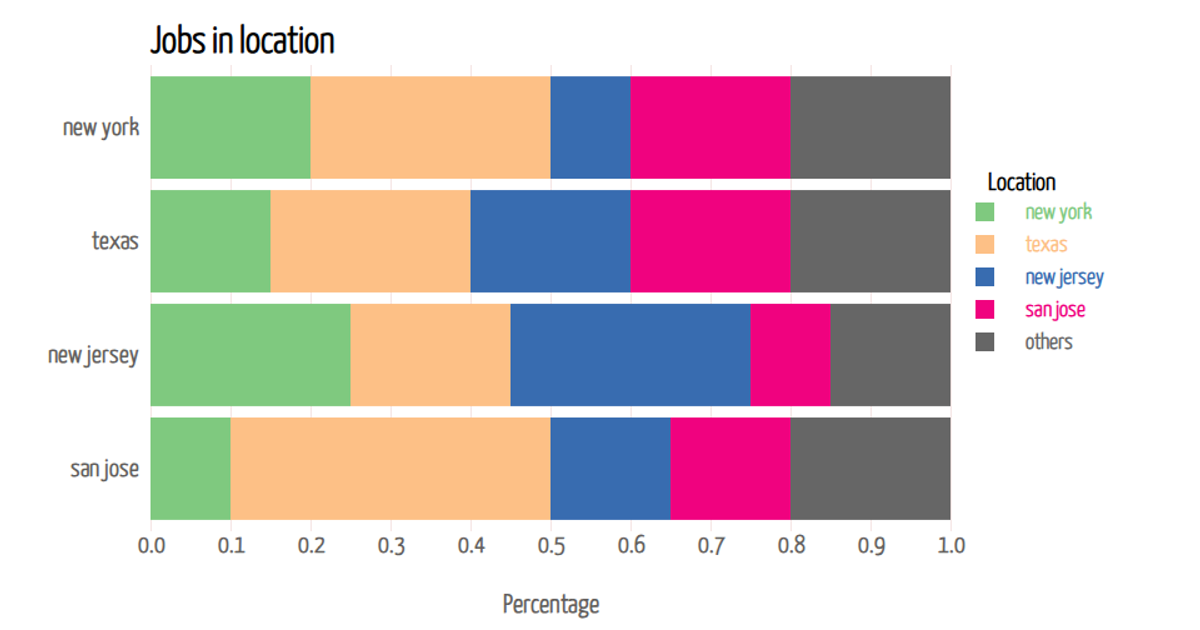
This example presents a horizontal stacked bar chart comparing tax revenue and excise revenue for ten Indian states, including Delhi, Maharashtra, and Gujarat. The chart visually separates the two revenue components using steelblue and orange bars, with the total length representing combined revenue. Built with D3.js v7, the visualization uses `d3.scaleBand` for the categorical state axis, `d3.scaleLinear` for the quantitative revenue axis, and `d3.stack` to prepare the data for rendering as SVG rectangles.
AI-generated descriptionMIT Licensed



Comments
Sign in to join the discussion.