🌍 Public
Migrantis cun spumadori
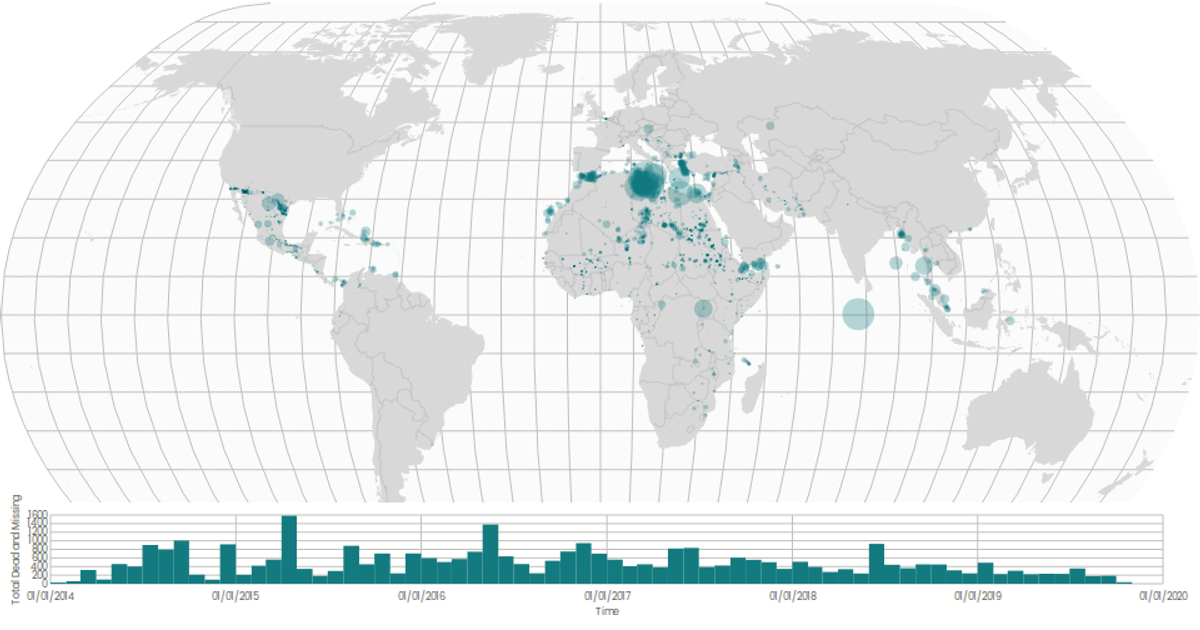
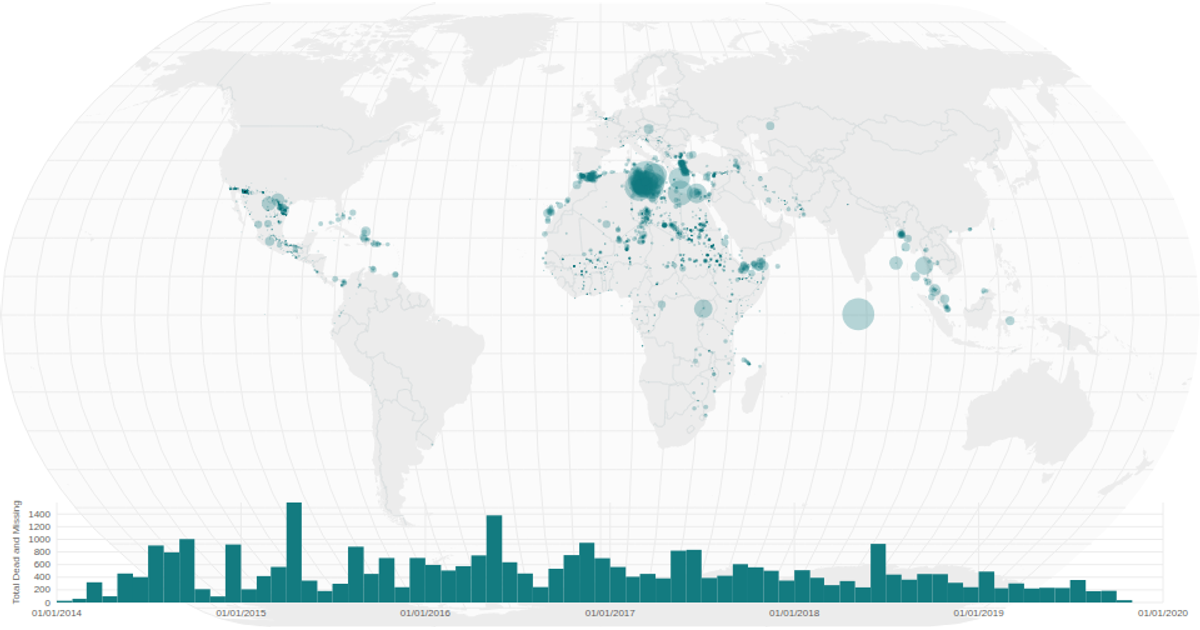
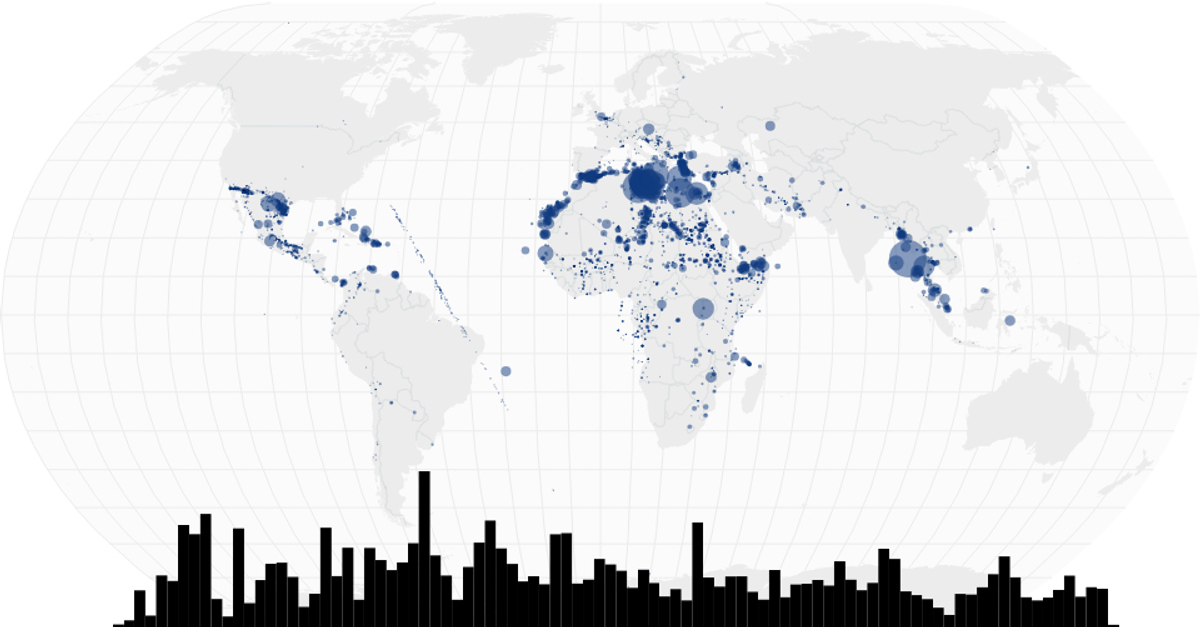
This interactive visualization combines a proportional symbol map with a time-series histogram to explore the global distribution of migrant deaths and disappearances. The map uses a square-root size scale for circles, projecting coordinates with D3's geoNaturalEarth1 projection and geoPath, while the histogram aggregates monthly totals using d3.bin and displays them as bars. A brushX interaction on the histogram filters the map's displayed data by date range. The visualization is built with React, D3 v5, and TopoJSON, rendering entirely in SVG, with the source data loaded from a CSV of missing migrants incidents.
AI-generated descriptionPlotting the migrants dataset on a map
MIT Licensed




Comments
Sign in to join the discussion.