Task_Activity_2
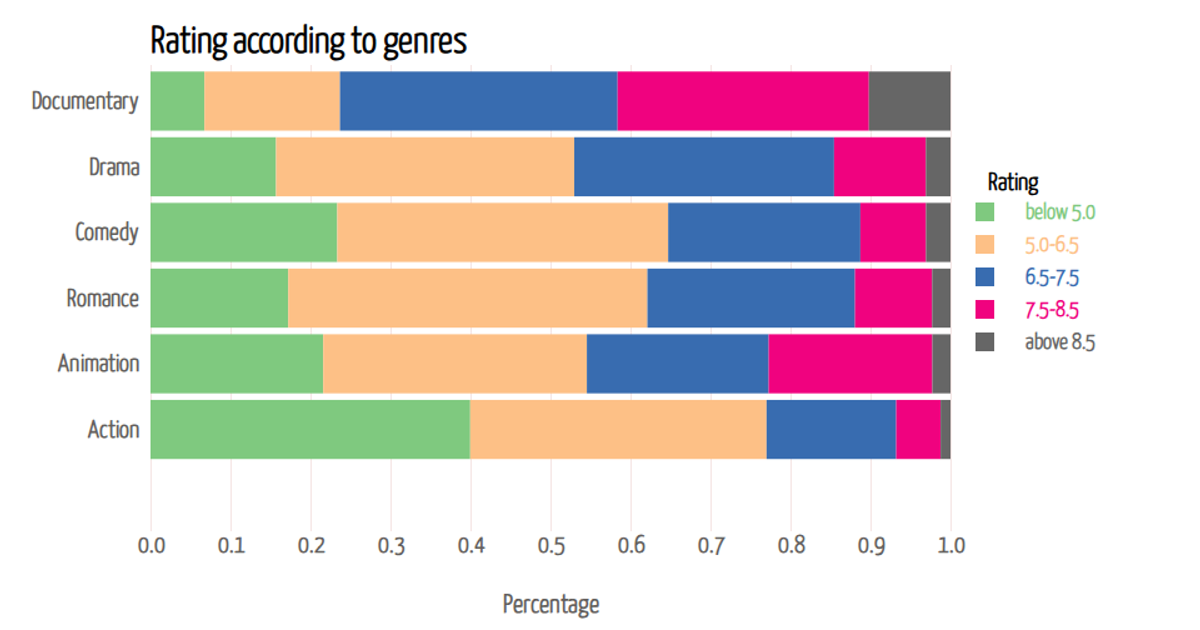
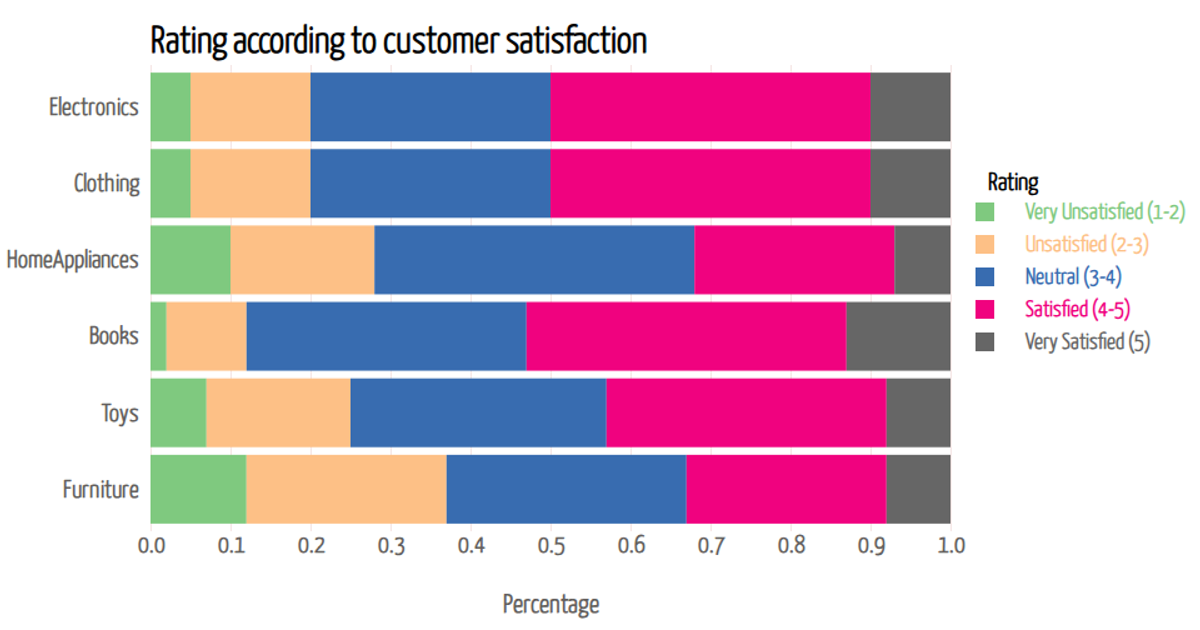
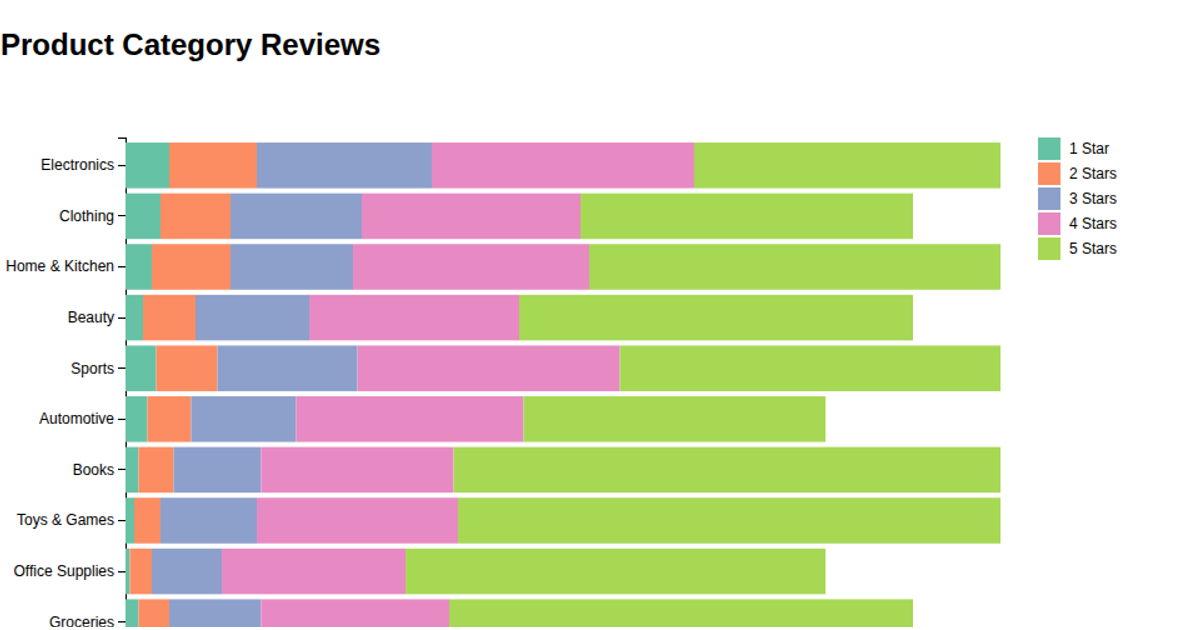
This visualization displays the proportion of patients rated across five severity categories for six diseases: Covid, TB, Cancer, HIV, Cold, and Fever. It uses a horizontal stacked bar chart, where each bar is segmented by percentage. The code uses D3 v7’s `d3.stack` for data processing, `d3.scaleOrdinal` for color, and `d3.axisLeft`/`d3.axisBottom` for axes. A tooltip reveals the exact percentage on hover. The data is loaded from a CSV file and rendered as SVG graphics.
AI-generated descriptionThe diseases and its effects
Fever, the common cold, TB, HIV/AIDS, and COVID-19 are all illnesses with different symptoms. The respiratory system is impacted by COVID-19, which can have serious health consequences. HIV/AIDS weakens immunity, making a person more vulnerable to infections and malignancies. Lung-related tuberculosis (TB) can be lethal if left untreated. Sneezing, coughing, and runny nose are typical cold symptoms. Hygiene and vaccinations are examples of preventive actions that are vital.





Comments
Sign in to join the discussion.