🌍 Public
Renderizando Datos
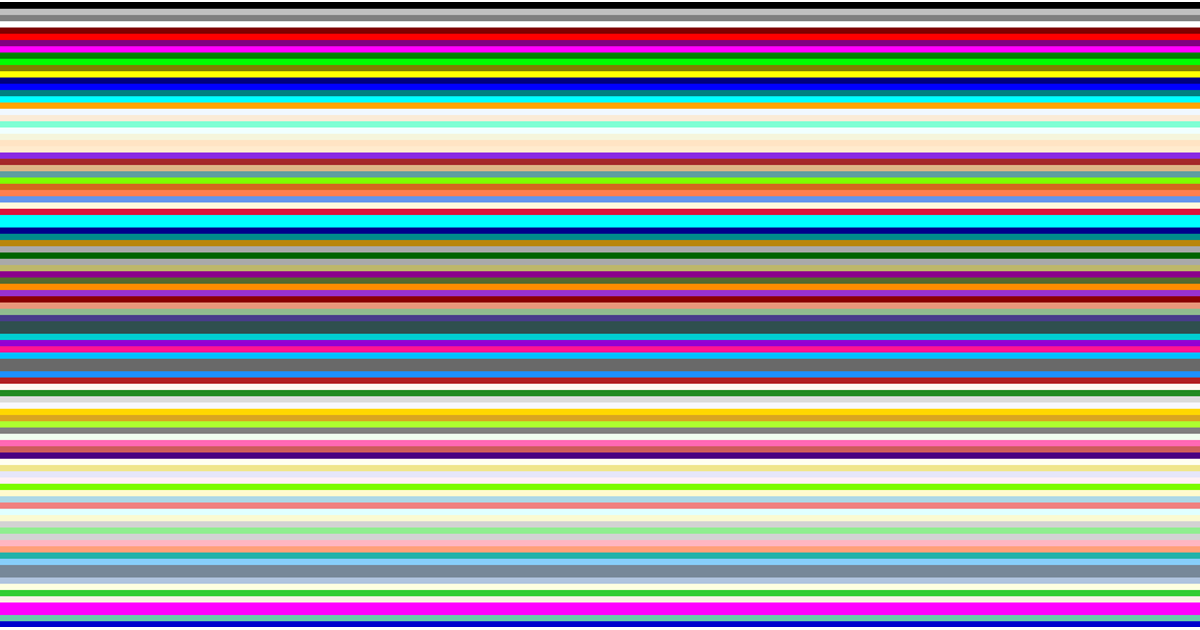
This example displays a vertical stack of horizontal stripes, each colored according to a CSS named color from a loaded dataset. It loads the data from a CSV file using D3’s `csv` utility, then uses React hooks (`useState` and `useEffect`) to asynchronously fetch and store the data. The `App` component maps over each row to render a div with a background color taken from the `RGB hex value` column. A loading message appears until the data arrives, and the final rendering fills the page with 960-pixel-wide bands.
AI-generated descriptionA program that loads in some data about CSS named colors using D3 utilities, and uses React state to keep track of the data.
MIT Licensed


Comments
Sign in to join the discussion.