🌍 Public
Vega-Lite API Template
CCurran Kelleher
Last edited Sep 16, 2019
Created on Sep 16, 2019
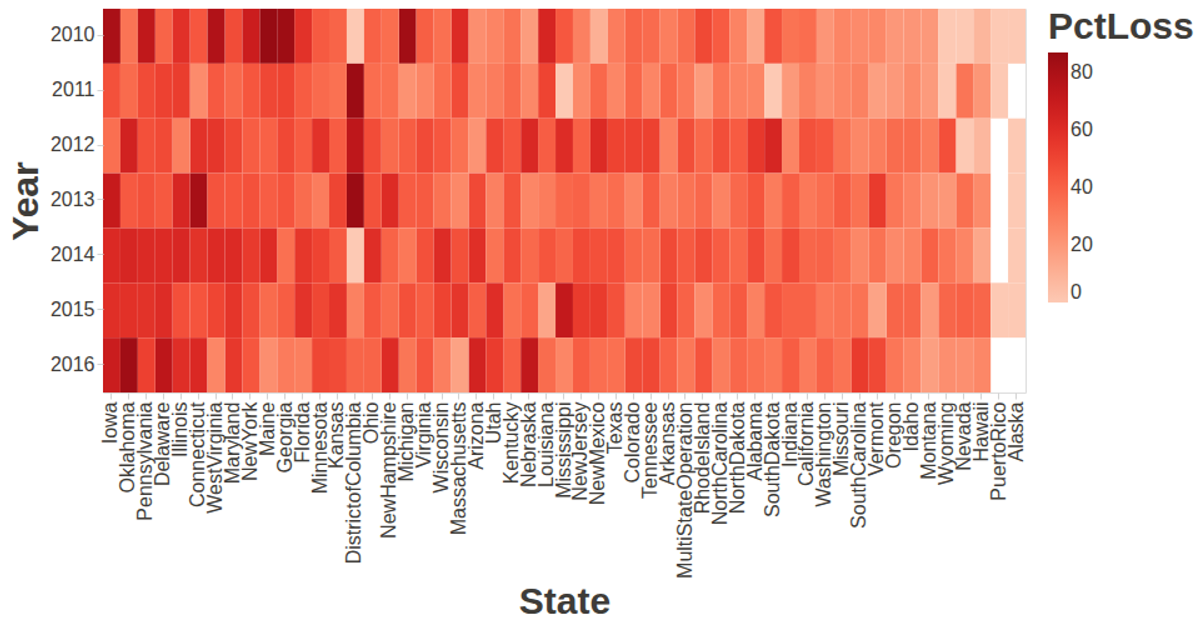
This visualization shows bee colony loss trends over time across different states, with each line representing a state’s annual colony counts. The graphic uses a line mark with size and opacity adjustments to display time-series data. The example is built with the Vega-Lite API, which wraps Vega-Lite and Vega, and incorporates D3.js for data loading via `d3.csv`. Data comes from a remote GitHub gist, and the visualization renders as a scalable SVG with an interactive tooltip handled by Vega-Tooltip.
AI-generated descriptionA visualization constructed using the vega-lite-api.
MIT Licensed


Comments
Sign in to join the discussion.