🌍 Public
test
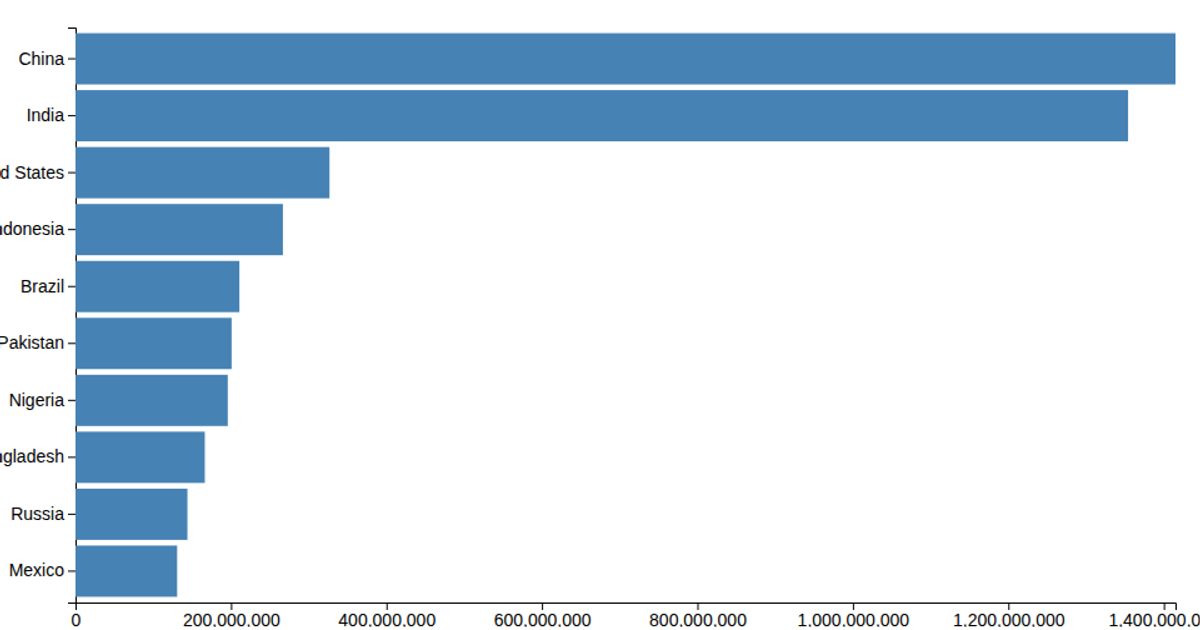
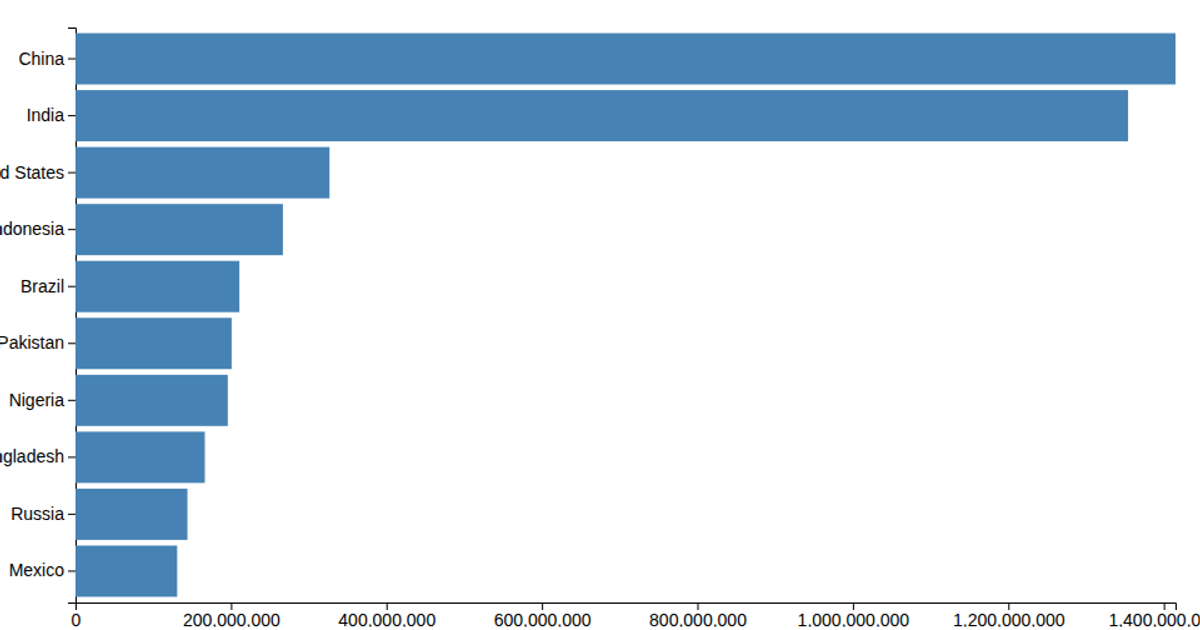
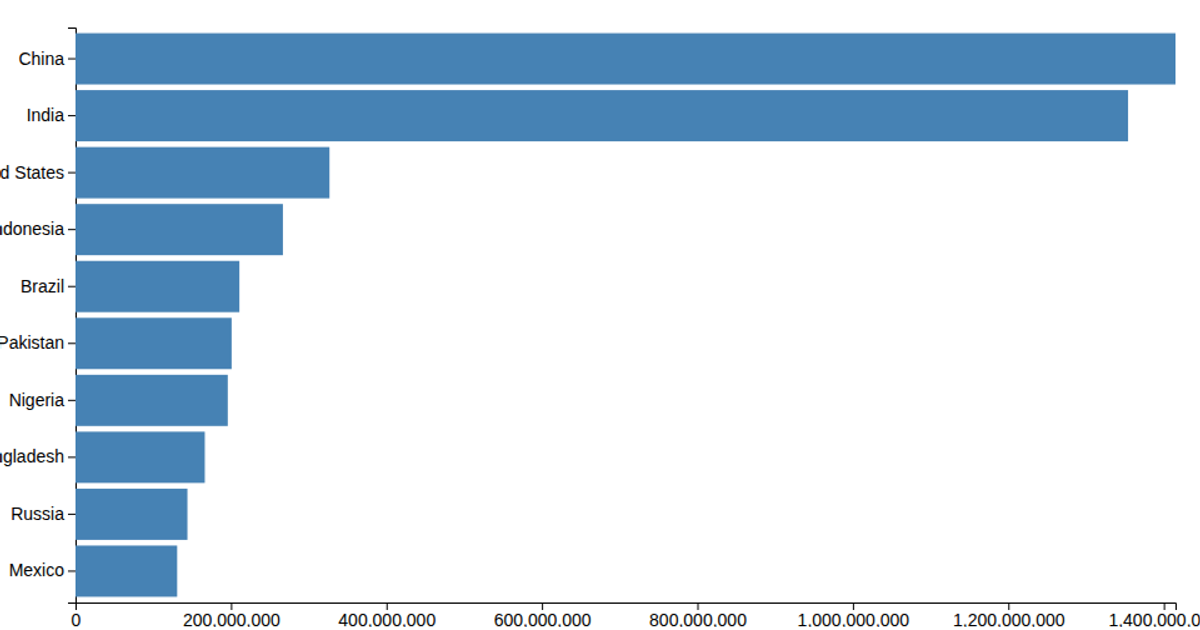
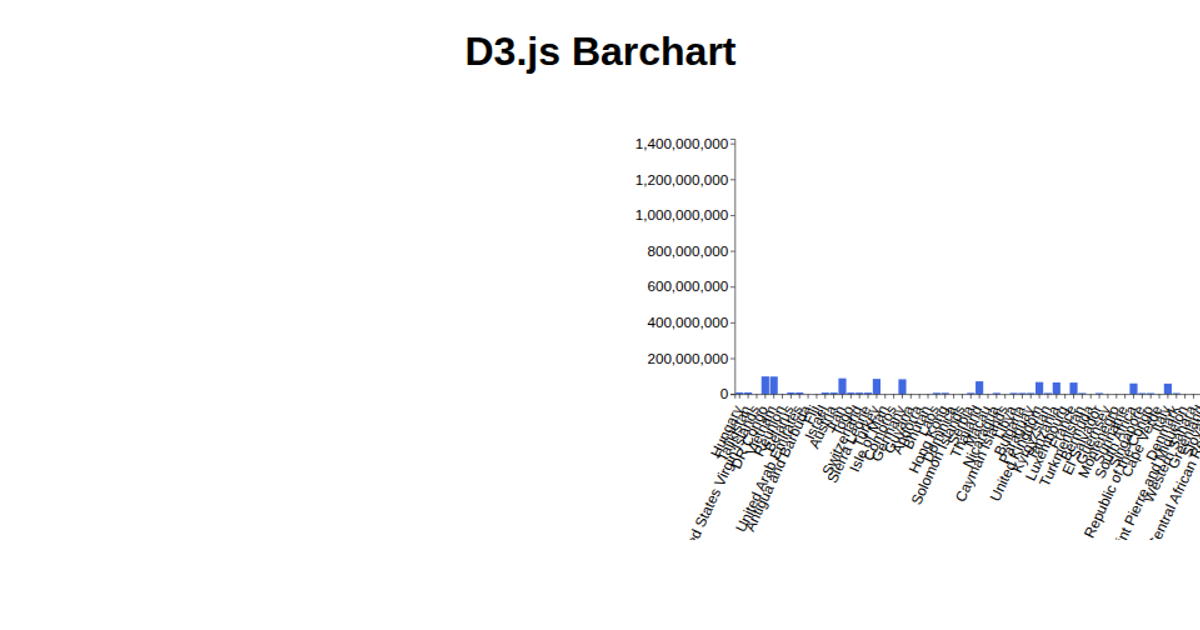
This example shows a bar chart of country populations that reorders its bars according to a user-selectable sorting option. The chart initially displays data in descending frequency order, but a dropdown menu allows switching between alphabetical and ascending or descending value sorting. The visualization uses D3 v6 APIs including `scaleLinear`, `scaleBand`, `axisLeft`, and `axisBottom`, with SVG rectangles for rendering. The data comes from a CSV file loaded into the chart.
AI-generated descriptionMIT Licensed




Comments
Sign in to join the discussion.