🌍 Public
Choropleth Map with Interactive Filtering
FFilippaNathhorst
Last edited Oct 30, 2019
Created on Oct 30, 2019
Forked from Choropleth Map with Interactive Filtering
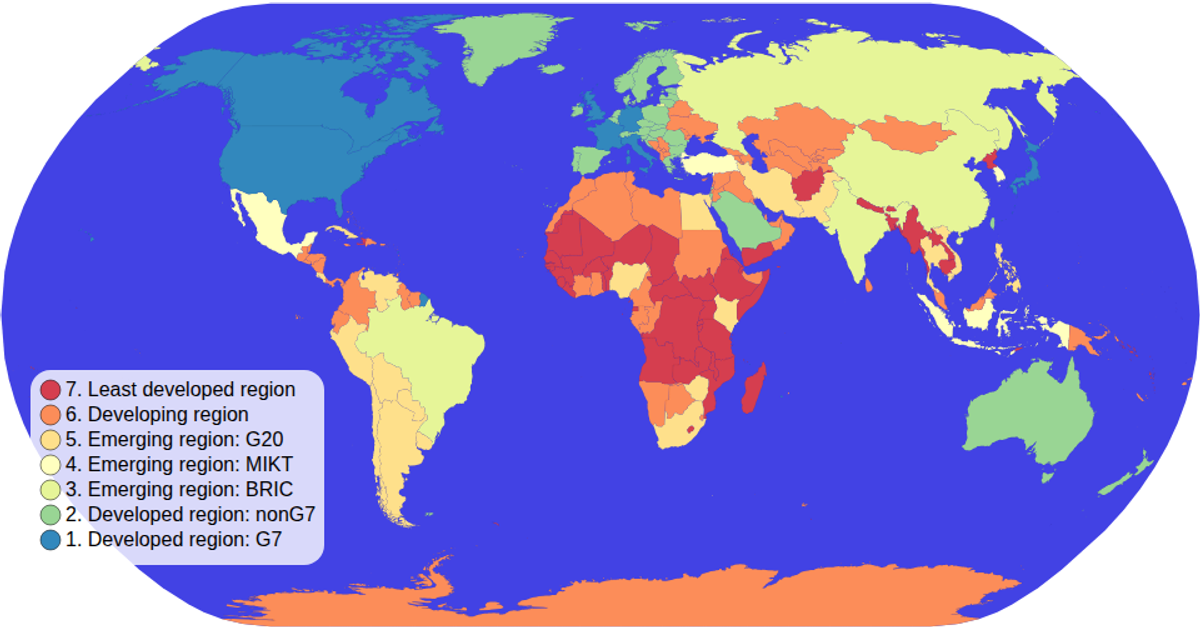
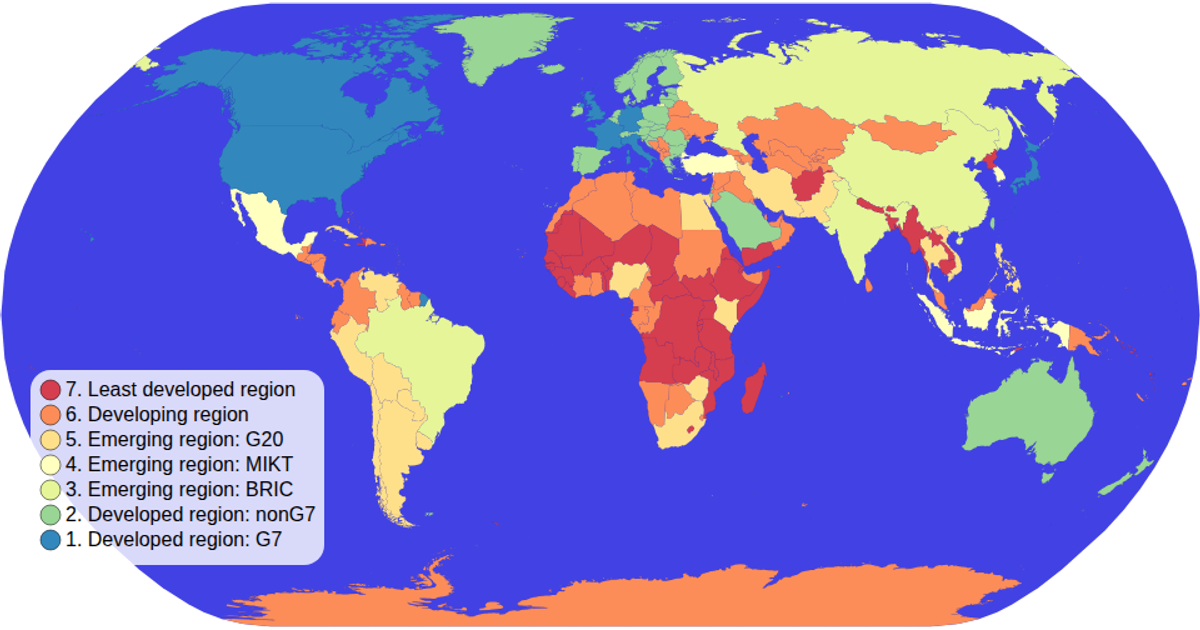
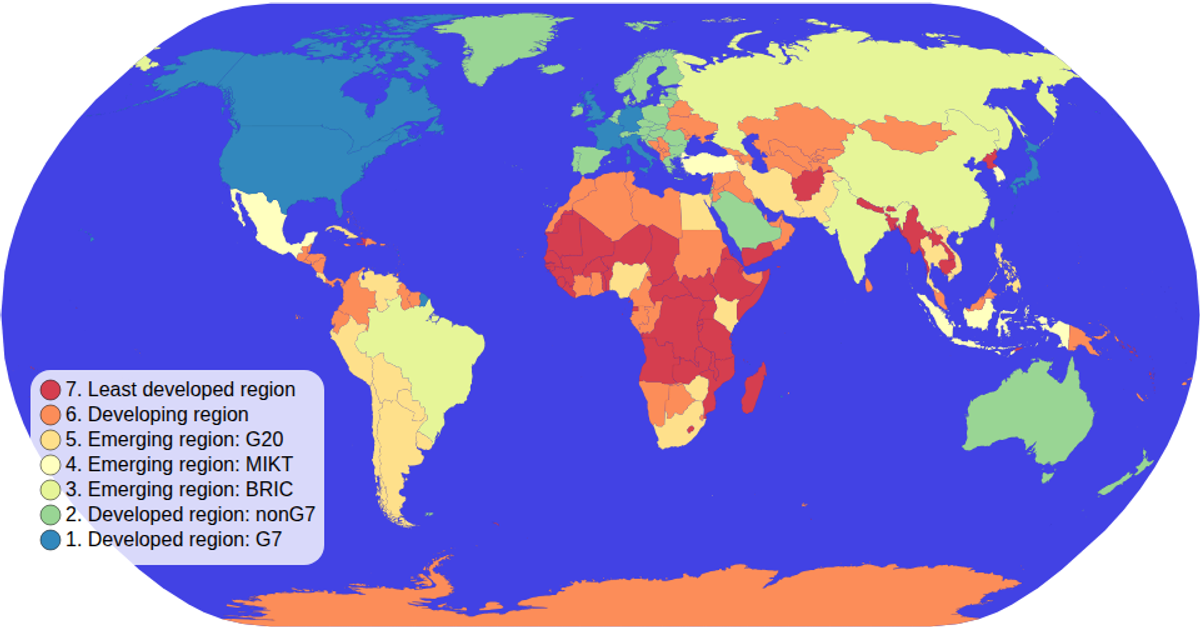
A choropleth map colored by economy type uses an ordinal color scale and a Natural Earth projection to display global income groups. Users hover over legend items to filter the map, dimming non-selected countries and highlighting matches. Built with D3 v5, it combines `d3.geoPath`, `d3.geoNaturalEarth1`, and `d3.zoom` for panning, while the legend uses `d3.scaleOrdinal` and `schemeSpectral`. Data comes from the World Atlas TopoJSON and TSV files rendered as SVG elements.
AI-generated descriptionA choropleth map where you can hover over items in the color legend items to interactively filter!
MIT Licensed




Comments
Sign in to join the discussion.