🌍 Public
Activity6_Tutorial_4_Poorna
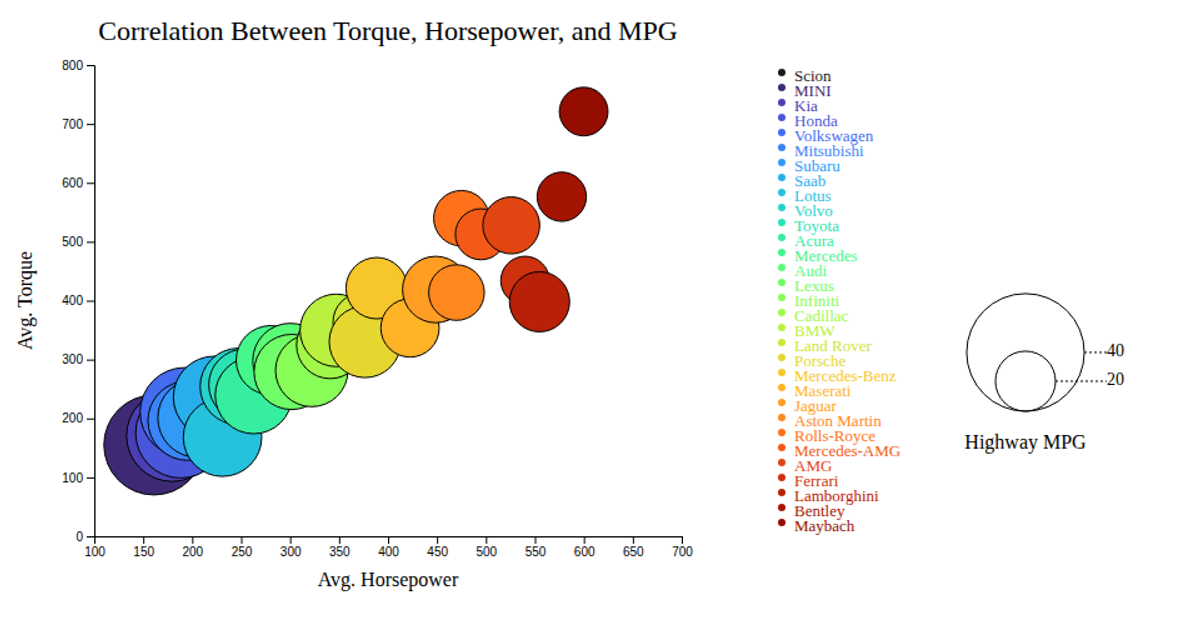
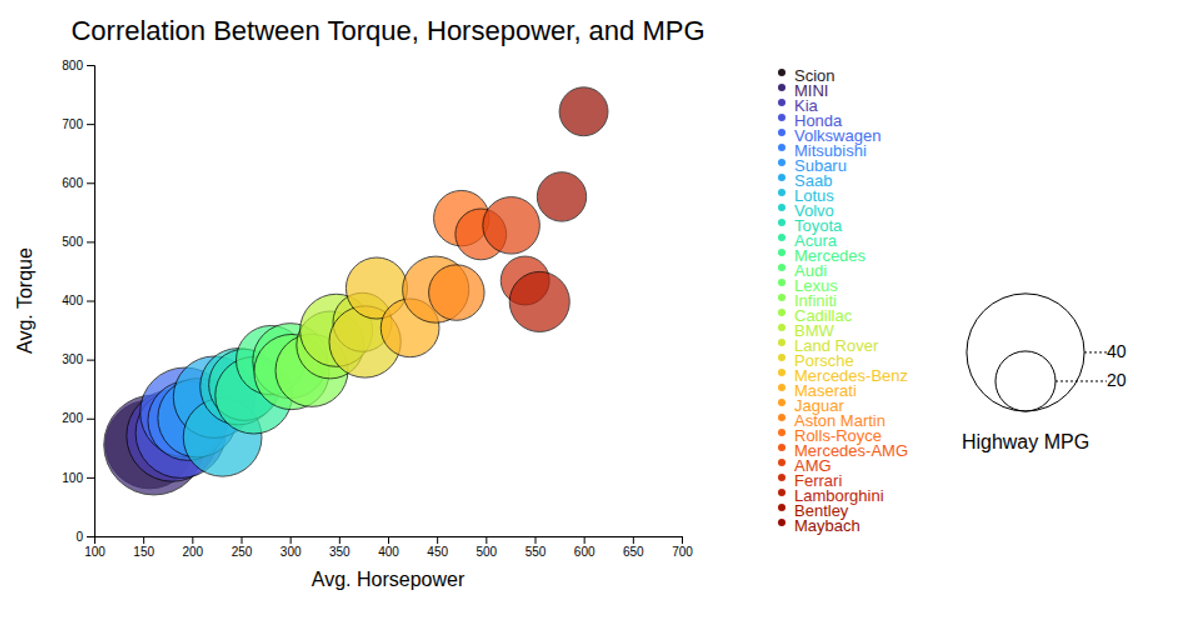
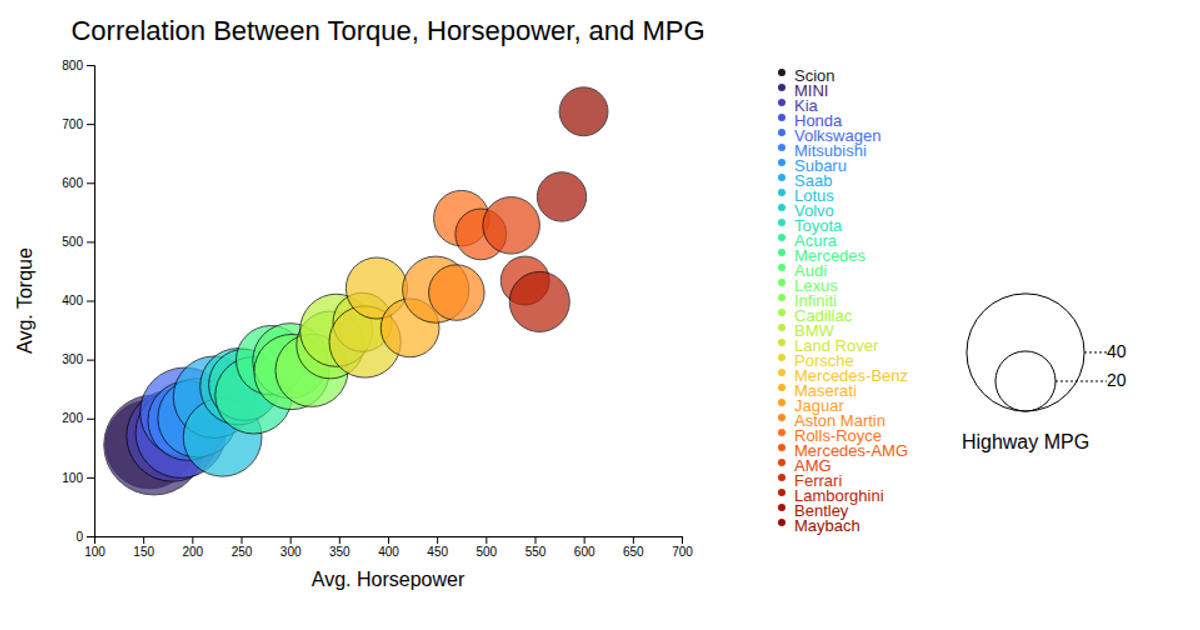
This bubble chart visualizes the correlation between average horsepower, torque, and highway MPG for various car makes. Each circle’s position maps horsepower and torque on the x- and y-axes, while its radius and color encode highway MPG and car brand, respectively. The visualization uses D3.js (v7) with SVG rendering, including interactive tooltips on mouseover. A legend for bubble size and color categories is provided, with data sourced from the bundled `bubblechart.csv` file.
AI-generated descriptionMIT Licensed




Comments
Sign in to join the discussion.