🌍 Public
multiseries line chart
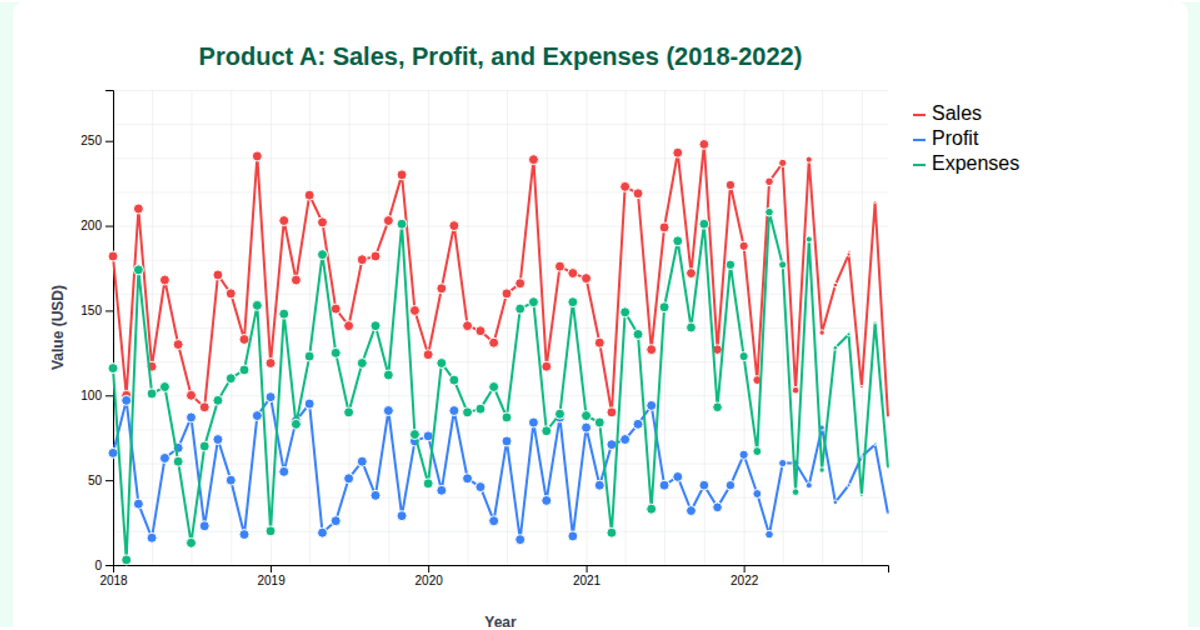
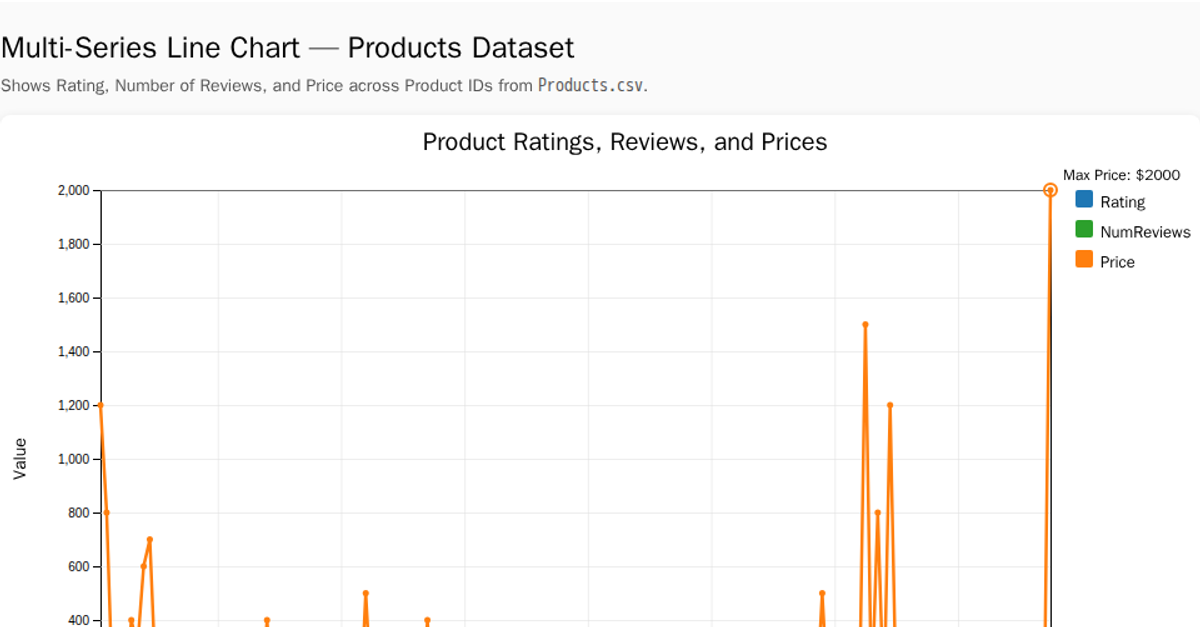
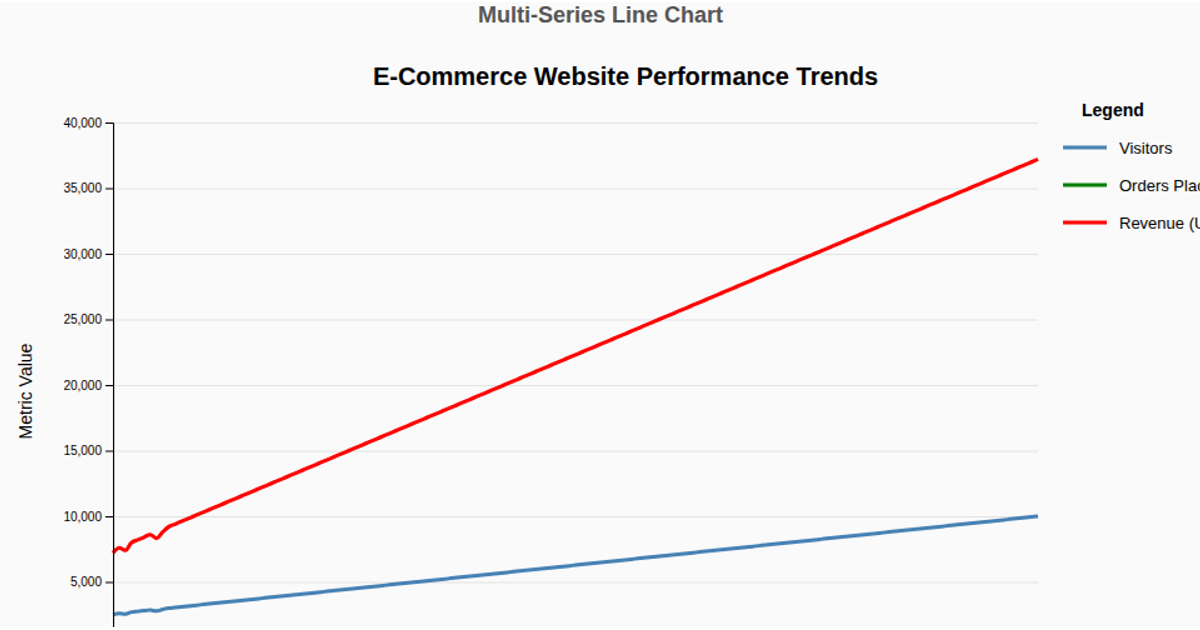
This multi-series line chart shows daily sales for Products A, B, and C over the first several months of 2025, with each product’s trend drawn as a separate colored line for comparison. A monetary annotation highlights the peak for Product A. A second chart uses a combo format, rendering daily advertising budget as gray bars and profit margin as a black monotone curve, with a dual y-axis for the two distinct scales. The code uses d3-based functions like `d3.timeParse`, `d3.scaleTime`, `d3.line` with `curveMonotoneX`, and `d3.axisBottom`, with data loaded from a CSV file via `d3.csv`. Both charts are rendered as SVG elements.
AI-generated descriptionMIT Licensed



Comments
Sign in to join the discussion.