🌍 Public
Pie Chart
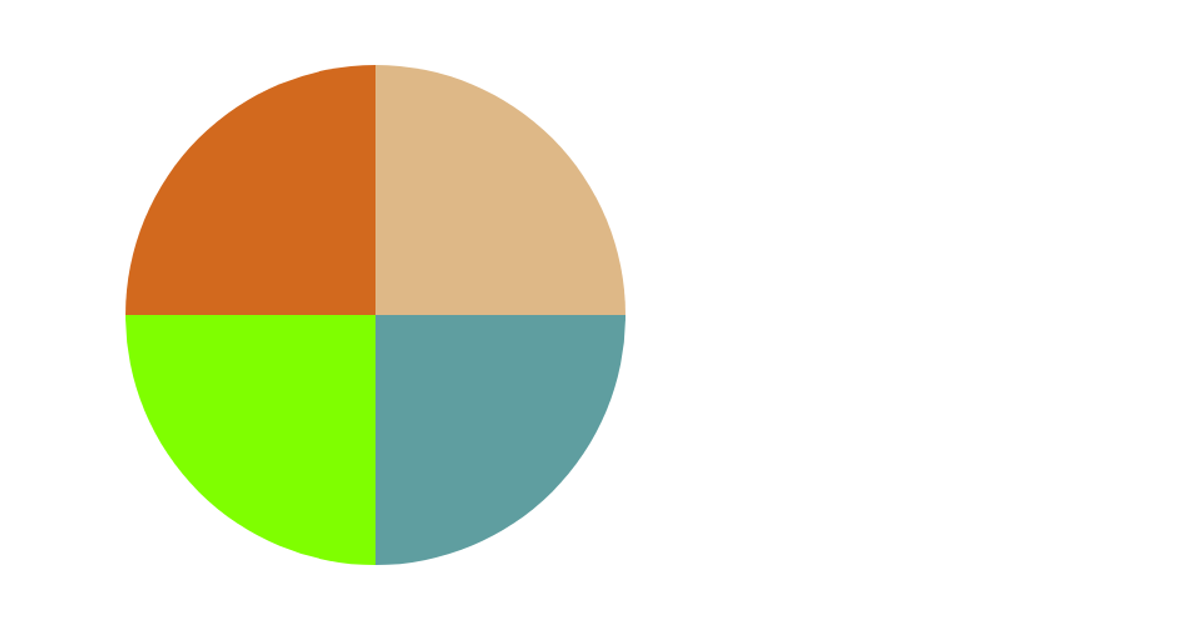
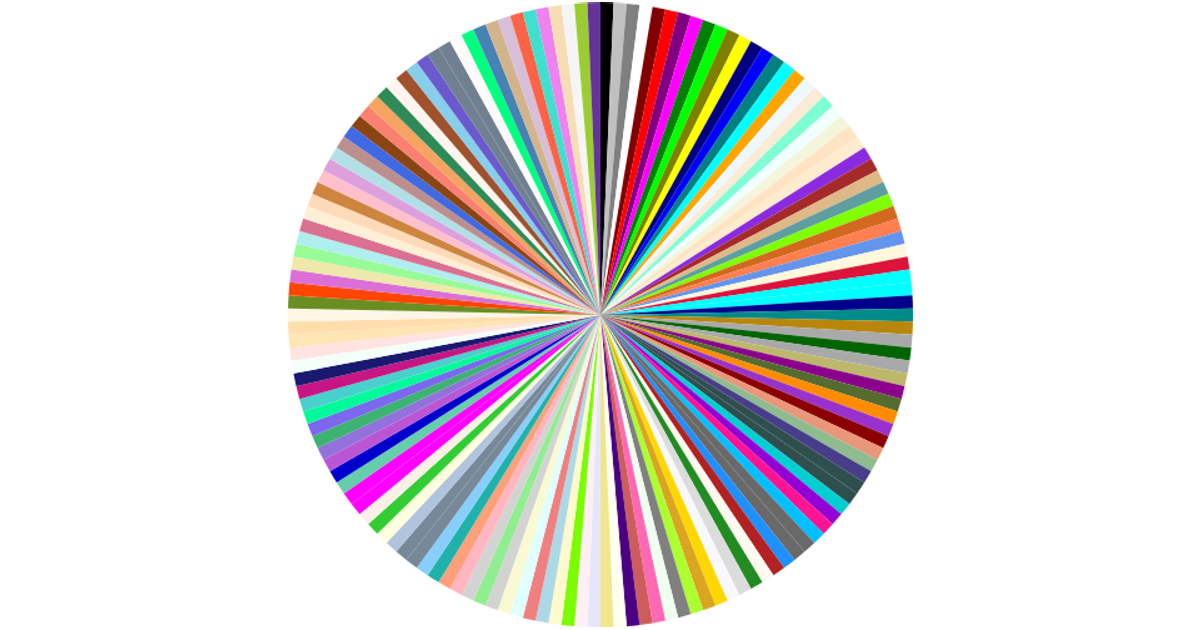
This pie chart visualizes task completion data loaded from a CSV file, with each slice representing a data row. The chart uses React state to manage the asynchronous data fetch and renders SVG paths via D3’s arc generator. The pie is centered on a 960×500 canvas, with each path drawn from the center outward using fixed inner and outer radii, and equal angular spans derived from the data length.
AI-generated descriptionA program that loads in some data about CSS named colors using D3 utilities, and uses React state to keep track of the data.
MIT Licensed






Comments
Sign in to join the discussion.